Browse other blogs
COMPANY
Browse other blogs
aerial-thermography-and-analytics-for-solar-site-inspection-and-maintenance
April 4, 2023
Aerial Thermography & Analytics For Solar Site Inspection and Maintenance
Team SenseHawk
Read more
Contact Us
Abhijit Sathe
CO-CEO, SB Enegry

Aerial thermography, combined with data analytics, is a faster and more accurate way to inspect solar sites and detect issues. The SenseHawk SDP integrates task management with aerial thermography and analytics for more efficient defect remediation during the construction and operations stages of a solar asset lifecycle.
Aerial thermography, combined with data analytics, is a faster and more accurate way to inspect solar sites and detect issues.
Renewable sources can help meet the growing demand for energy without putting undue stress on the environment. This has fuelled solar photovoltaic (PV) installations globally. While initial installation costs of utility scale solar are significant, proper operations and maintenance (O&M) can extend the lifetime of solar PV sites to 35 years and beyond.
PV solar sites are typically remote and spread across anywhere from 50 to 1000 acres of land. This makes regular manual inspection and maintenance a resource- and time-intensive process. In the last decade, aerial thermography with drones, and now manned aircraft, has emerged as a faster and better option for solar site inspections.
Advantages of using aerial thermography on solar sites
Solar modules can develop hotspots—areas where unusually high temperature is causing material degradation and lowering power output—due to installation issues, faulty cells, mechanical damage, and soiling. Aerial thermography helps to quickly detect hotspots across large areas, enabling targeted repair and maintenance. It also allows for the regular monitoring of module temperatures to assess whether the modules are functioning optimally and schedule maintenance to improve the power plant’s performance and output.
Aerial thermography involves the use of sensor-equipped cameras mounted on aerial vehicles to capture images of the solar site. Scanning the site with infrared (IR) cameras helps detect hotspots or other thermal anomalies that indicate problems requiring investigation. Using photogrammetry, the images are overlapped and analyzed to get reliable measurements that are used to create a thermal map of the surveyed area.
Analytics can extract further insights from the thermal data generated from aerial thermography. Analyzing the aerial thermography imagery using machine learning (ML) algorithms helps identify and even classify hotspots.
Classifying defects based on their thermal signatures allows users to prioritize remediation based on the severity of the issue, which can range from dangerous overheating of damaged panels to underperformance due to shading. This helps operators go beyond image processing and defect detection to asset performance optimization and predictive maintenance.
The benefits of using aerial thermography and analytics for site maintenance include:
Quick and accurate - identifying defects across large sites without missing anything
Proactive detection of issues before they become serious
Cost savings over time - by tracking issues, scheduling maintenance for optimal performance, and reducing energy wastage
Technician safety - minimizing manual inspections on vast solar fields with unsafe terrains
Integrating task management with aerial thermography and analytics for more efficient defect remediation
The SenseHawk Solar Digitization Platform (SDP) is custom-built to help solar asset stakeholders visualize, manage, track, collaborate, and remediate using a single asset-centric platform that digitally captures the onsite realities of the project. Among the powerful features to monitor and manage different stages of the solar asset lifecycle is OBSERVE, the aerial scan based defect detection and remediation feature of the platform.
OBSERVE helps resolve solar site performance issues efficiently with aerial thermography for defect detection and integrated defect-related task creation, assignment, and tracking for faster remediation.
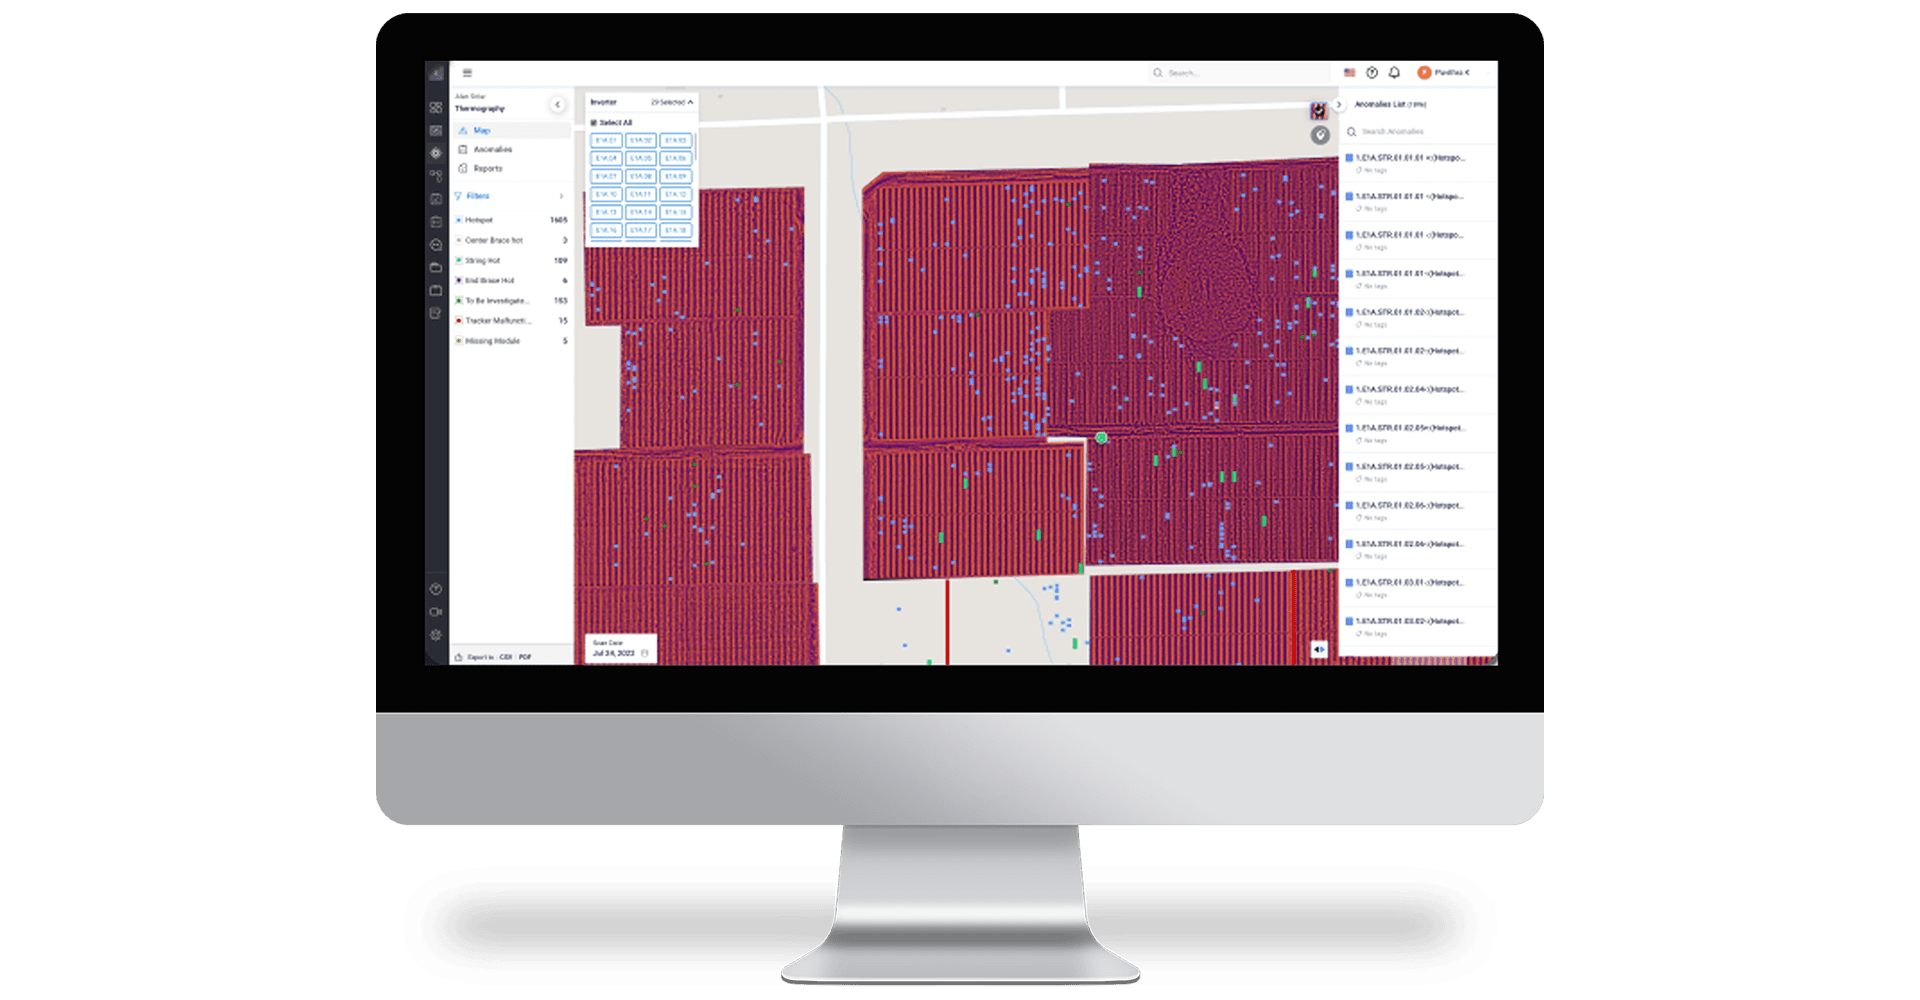
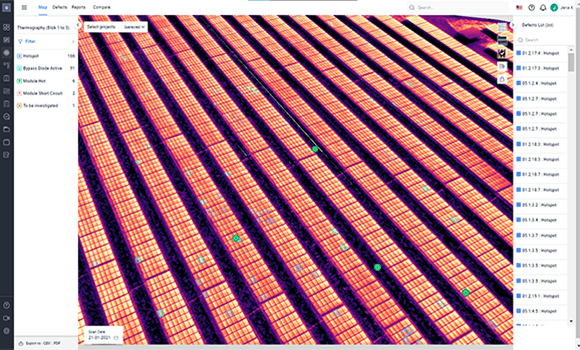
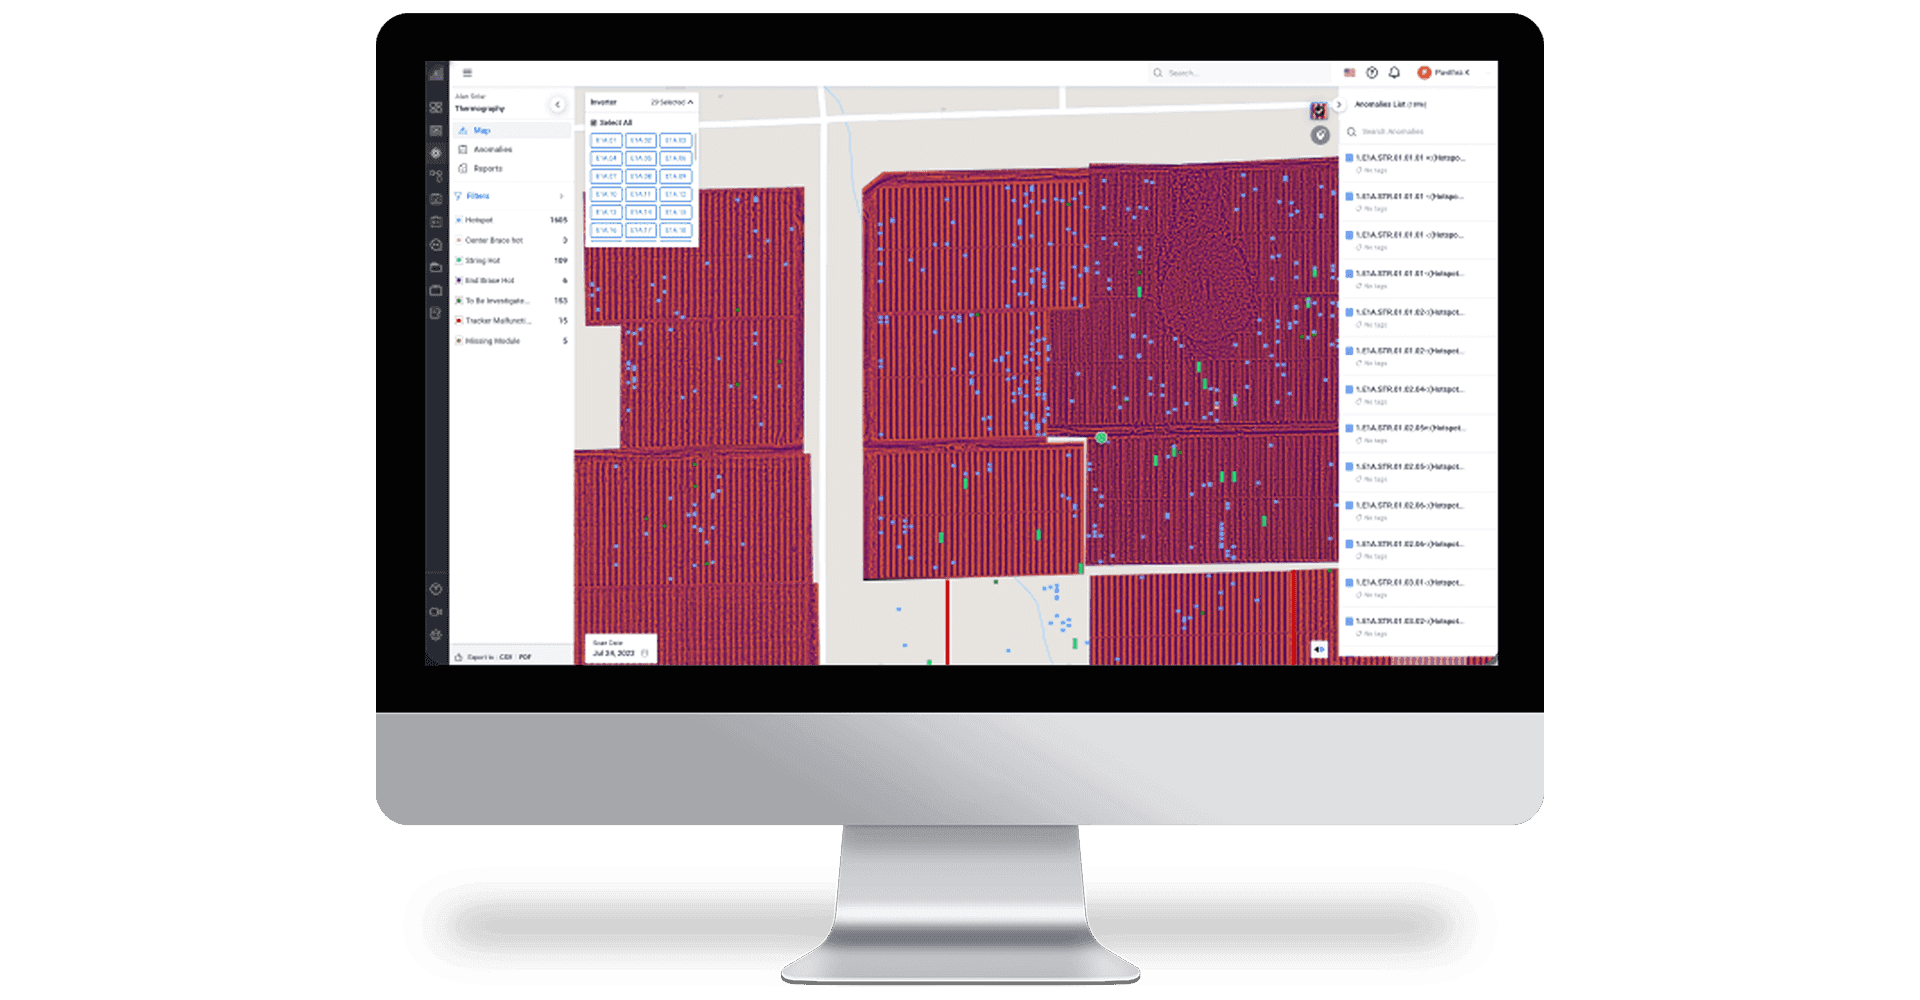
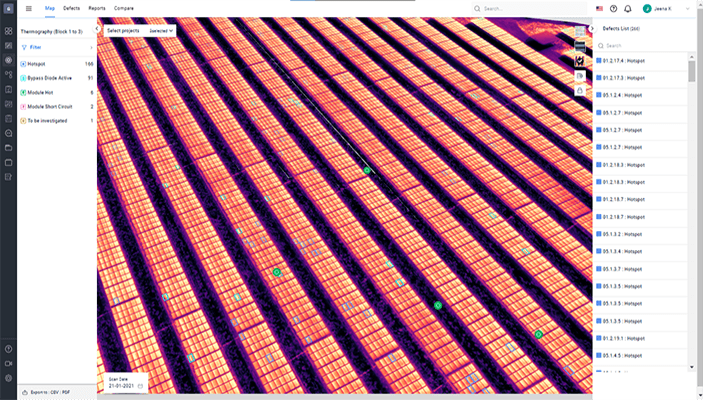
Figure 1: Interactive thermographic map view of solar site on the SenseHawk SDP with defects list that can be easily assigned as tasks.
Proprietary ML models are applied to analyze site imagery, gathered using IR camera-equipped drones, to identify defects and classify them based on probable cause and issue severity. The thermal map of the defects is layered on the comprehensive digital model of the site created on the SDP using the Asset Information Model (AIM).
Each identified defect is viewed as an assigned task by onsite teams that can investigate, remediate, or provide status updates on the SDP. Custom defect lists, generated using various filters such as defect type, priority, temperature range, task assignee, or due date, can be easily shared with teams.
Viewable on the SenseHawk desktop and mobile apps, these reports incorporate hotspot locations, string numbers, temperature deltas, and defect classification, among other useful details, to aid field teams in the remediation of mechanical and electrical issues. OBSERVE can also generate a list of defects caused by faults in the module to support any warranty claims.
The SenseHawk mobile app, GO, allows field technicians to navigate directly to the geolocated tasks, access component data, get expert help if required, and create status updates with media attachments.
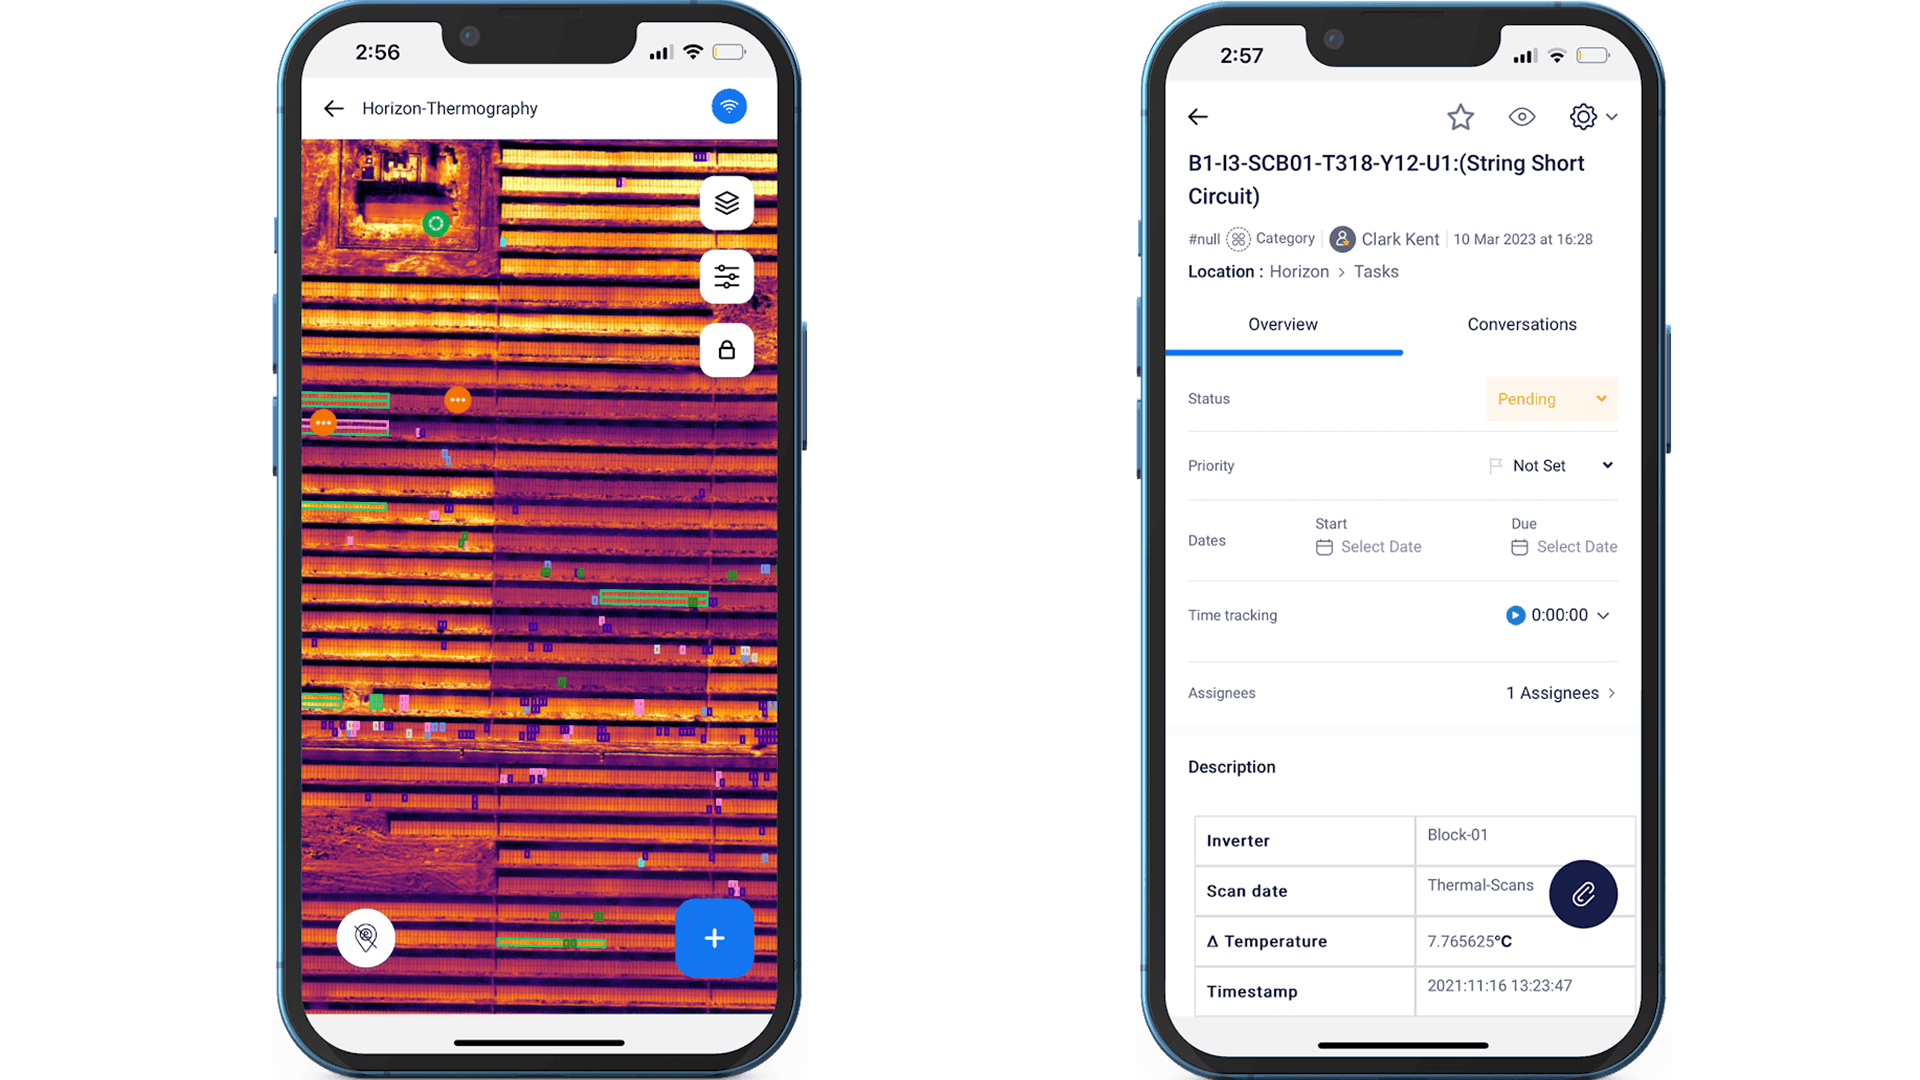
Figure 2: Mobile views of site defects on a map for easy navigation to the issue location and open Task with details to ease investigation
The SenseHawk SDP for all solar site stakeholders
The SenseHawk SDP supports the defect management needs of all project stakeholders. During the construction stage, EPCs and commissioning teams can use OBSERVE to ensure timely fixes for all installation issues and on-time commissioning of assets with optimal yield from the onset. They can perform operations checks, track issues, and remediate to reduce rework before handover. They can also easily digitize handovers and transfer data to the O&M team with centralized records.
O&M providers can use OBSERVE to optimize maintenance schedules, integrate all available site reports, access historic component data, and automate the creation of tasks. The in-built forms and workflows help speed up task assignment, updates, and progress reporting.
Field mobility, enabled by the fieldworker app GO, enhances coordination between deskside and onsite teams. Configurable asset dashboards help O&M providers track everything from task assignment to closure and also visualize status updates.
Site owners can use OBSERVE to optimize asset efficiency with corrective and scheduled maintenance through each asset lifecycle stage. They can also generate data to make timely warranty claims based on listed defects caused by module manufacturing issues.
The SenseHawk SDP thus combines aerial thermography, analytics, and defect remediation to provide the highest value to solar stakeholders. With OBSERVE, users can:
View all defects on a map with associated details. This makes navigation to the issue location,accessing relevant information, and uploading progress reports from the field easy and issue investigation easy using the mobile interface.
Drive remediation with integrated systems that help to locate all defects, prioritize critical issues, use checklists/docs to manage processes, and assign tasks to field teams to evaluate and remediate.
Fix defective components efficiently by easily locating them on a thermal map of the site and accessing installation files and warranty data with AIM to identify batches for timely warranty claims and replacements.
Know more about how the SenseHawk SDP can help you manage processes at your solar sites. Drop an email to contact@sensehawk.com to start the conversation.
