
200+ GW of solar and storage managed globally
The Operating System for Solar Project Management
One platform to manage every phase of your solar project - replacing spreadsheets, disconnected tools, and manual reporting.


One platform for the entire solar lifecycle
Your solar data lives in spreadsheets, ERPs, and WhatsApp threads. These data silos prevent easy transfer of information between teams during Development, Construction and Handover to Operations.
SenseHawk brings it all into one map-based platform — connecting scattered teams, fragmented workflows, and lifecycle gaps into a single source of truth.

The Solar Value Chain
Empowering every role in the solar value chain.
From pre-construction to repowering, we provide a unified geospatial system of record - connecting scattered teams and siloed data across your entire portfolio.


Our Features
Everything your team needs - in one place
Your project data flows seamlessly from planning through construction to long-term operations — nothing gets lost between phases.
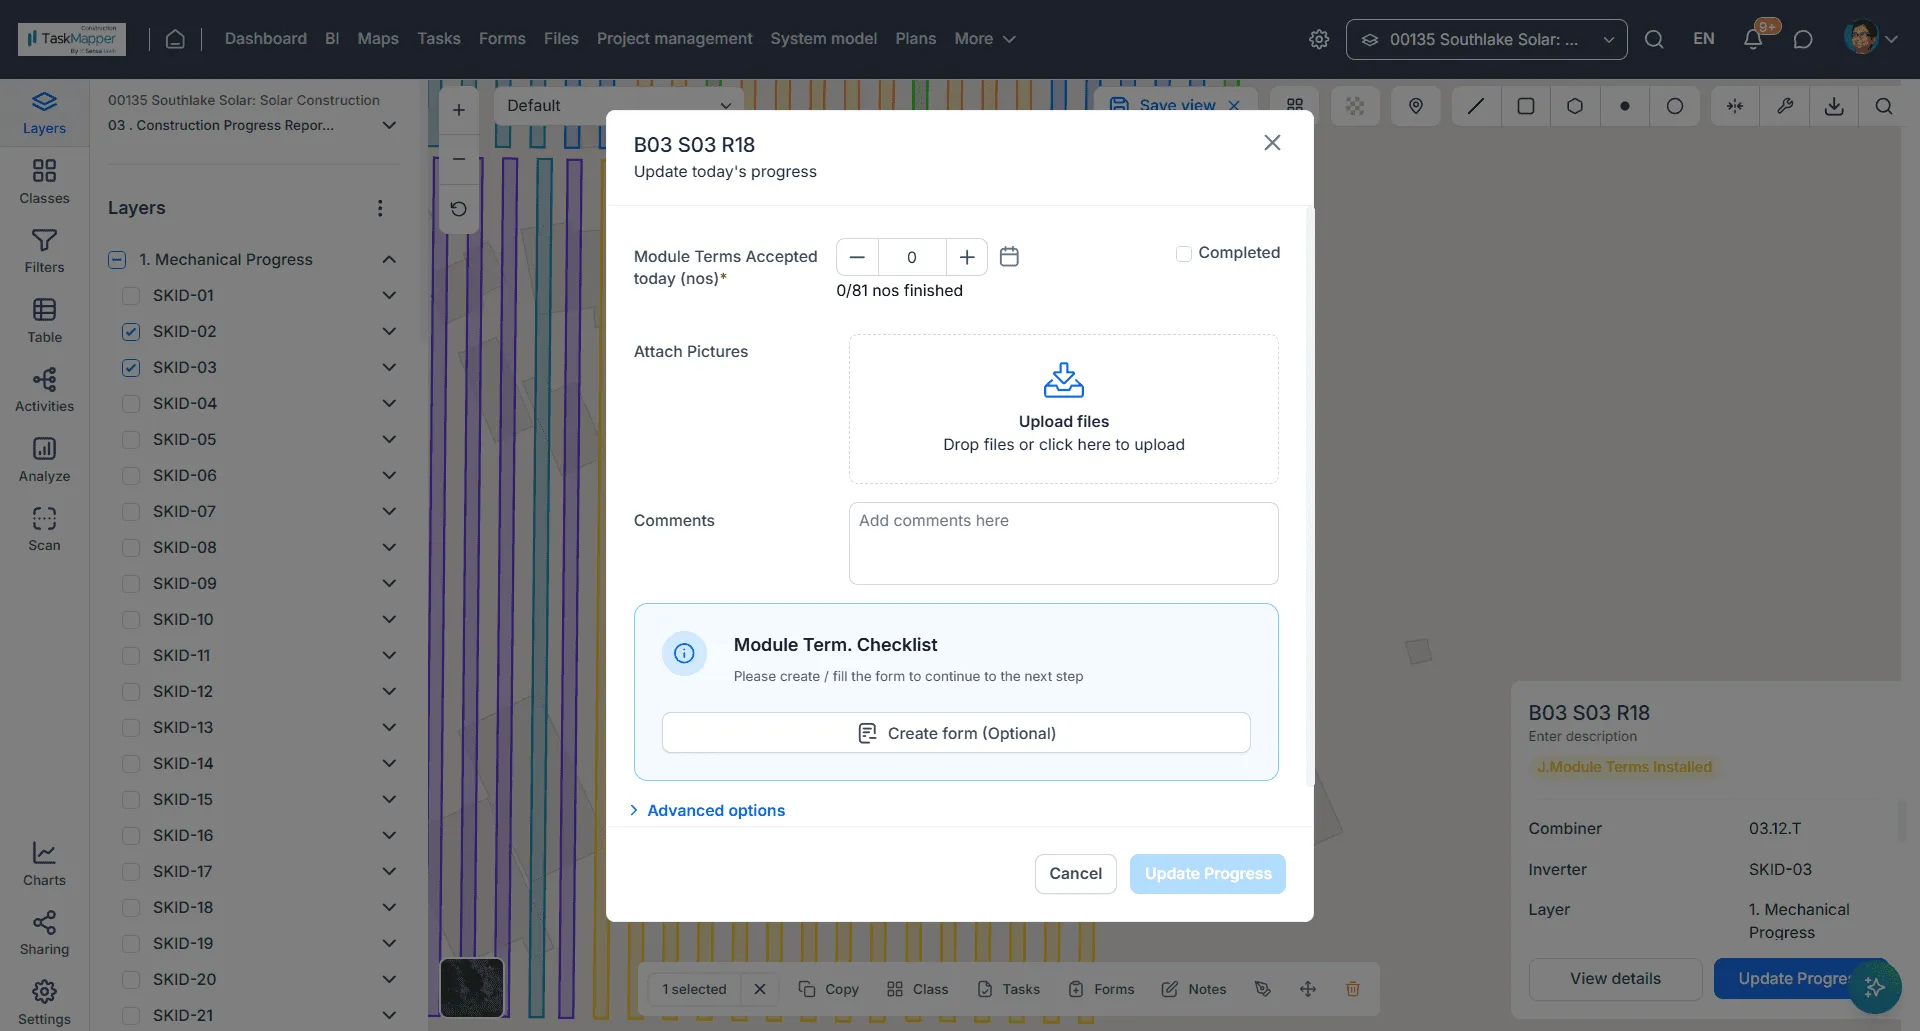
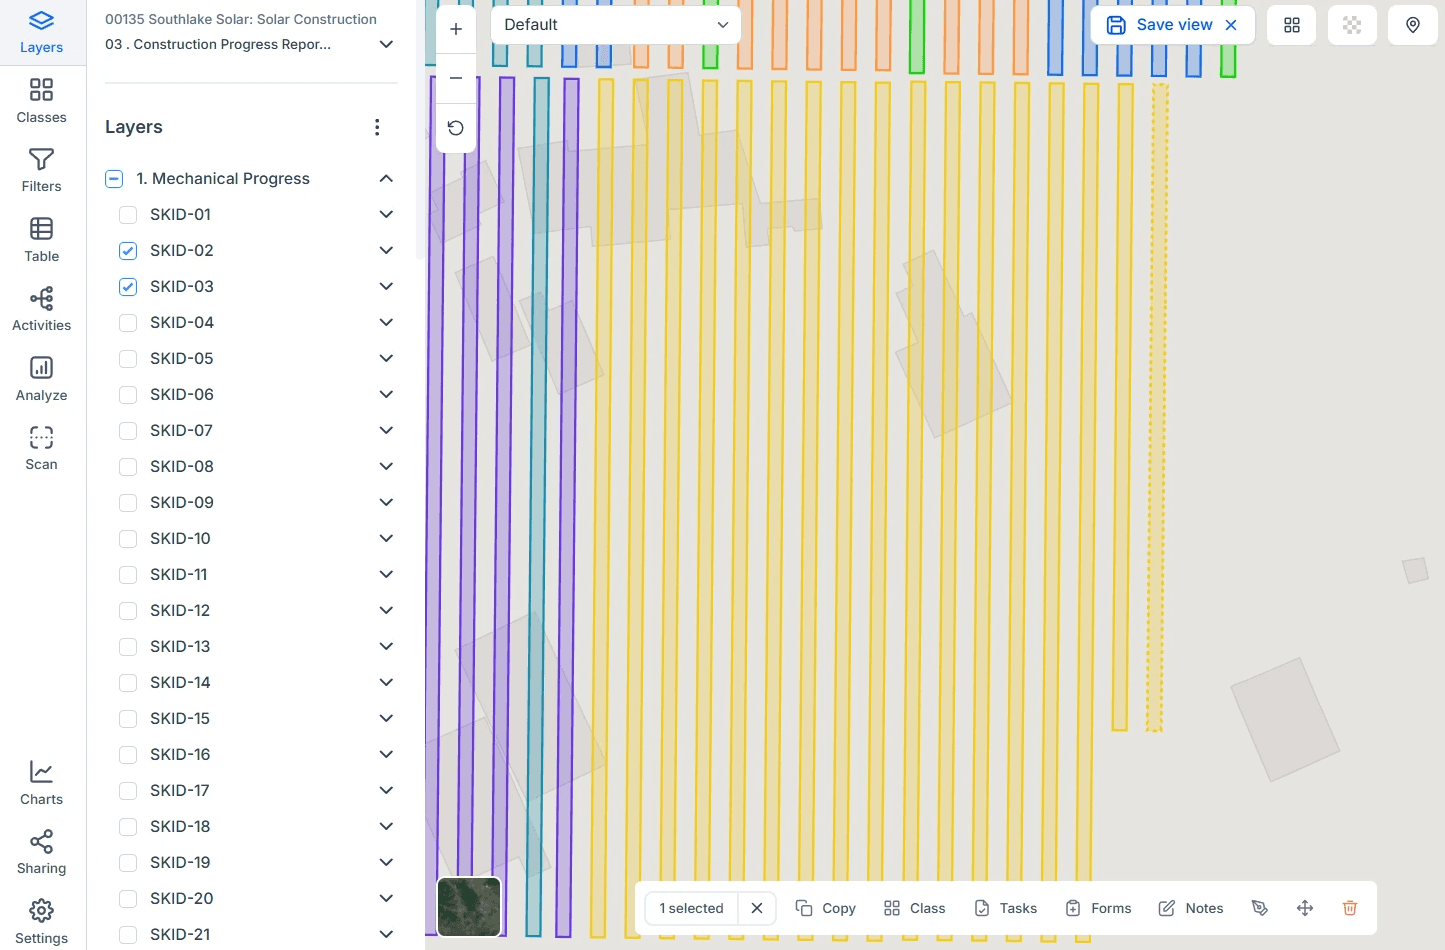
Maps
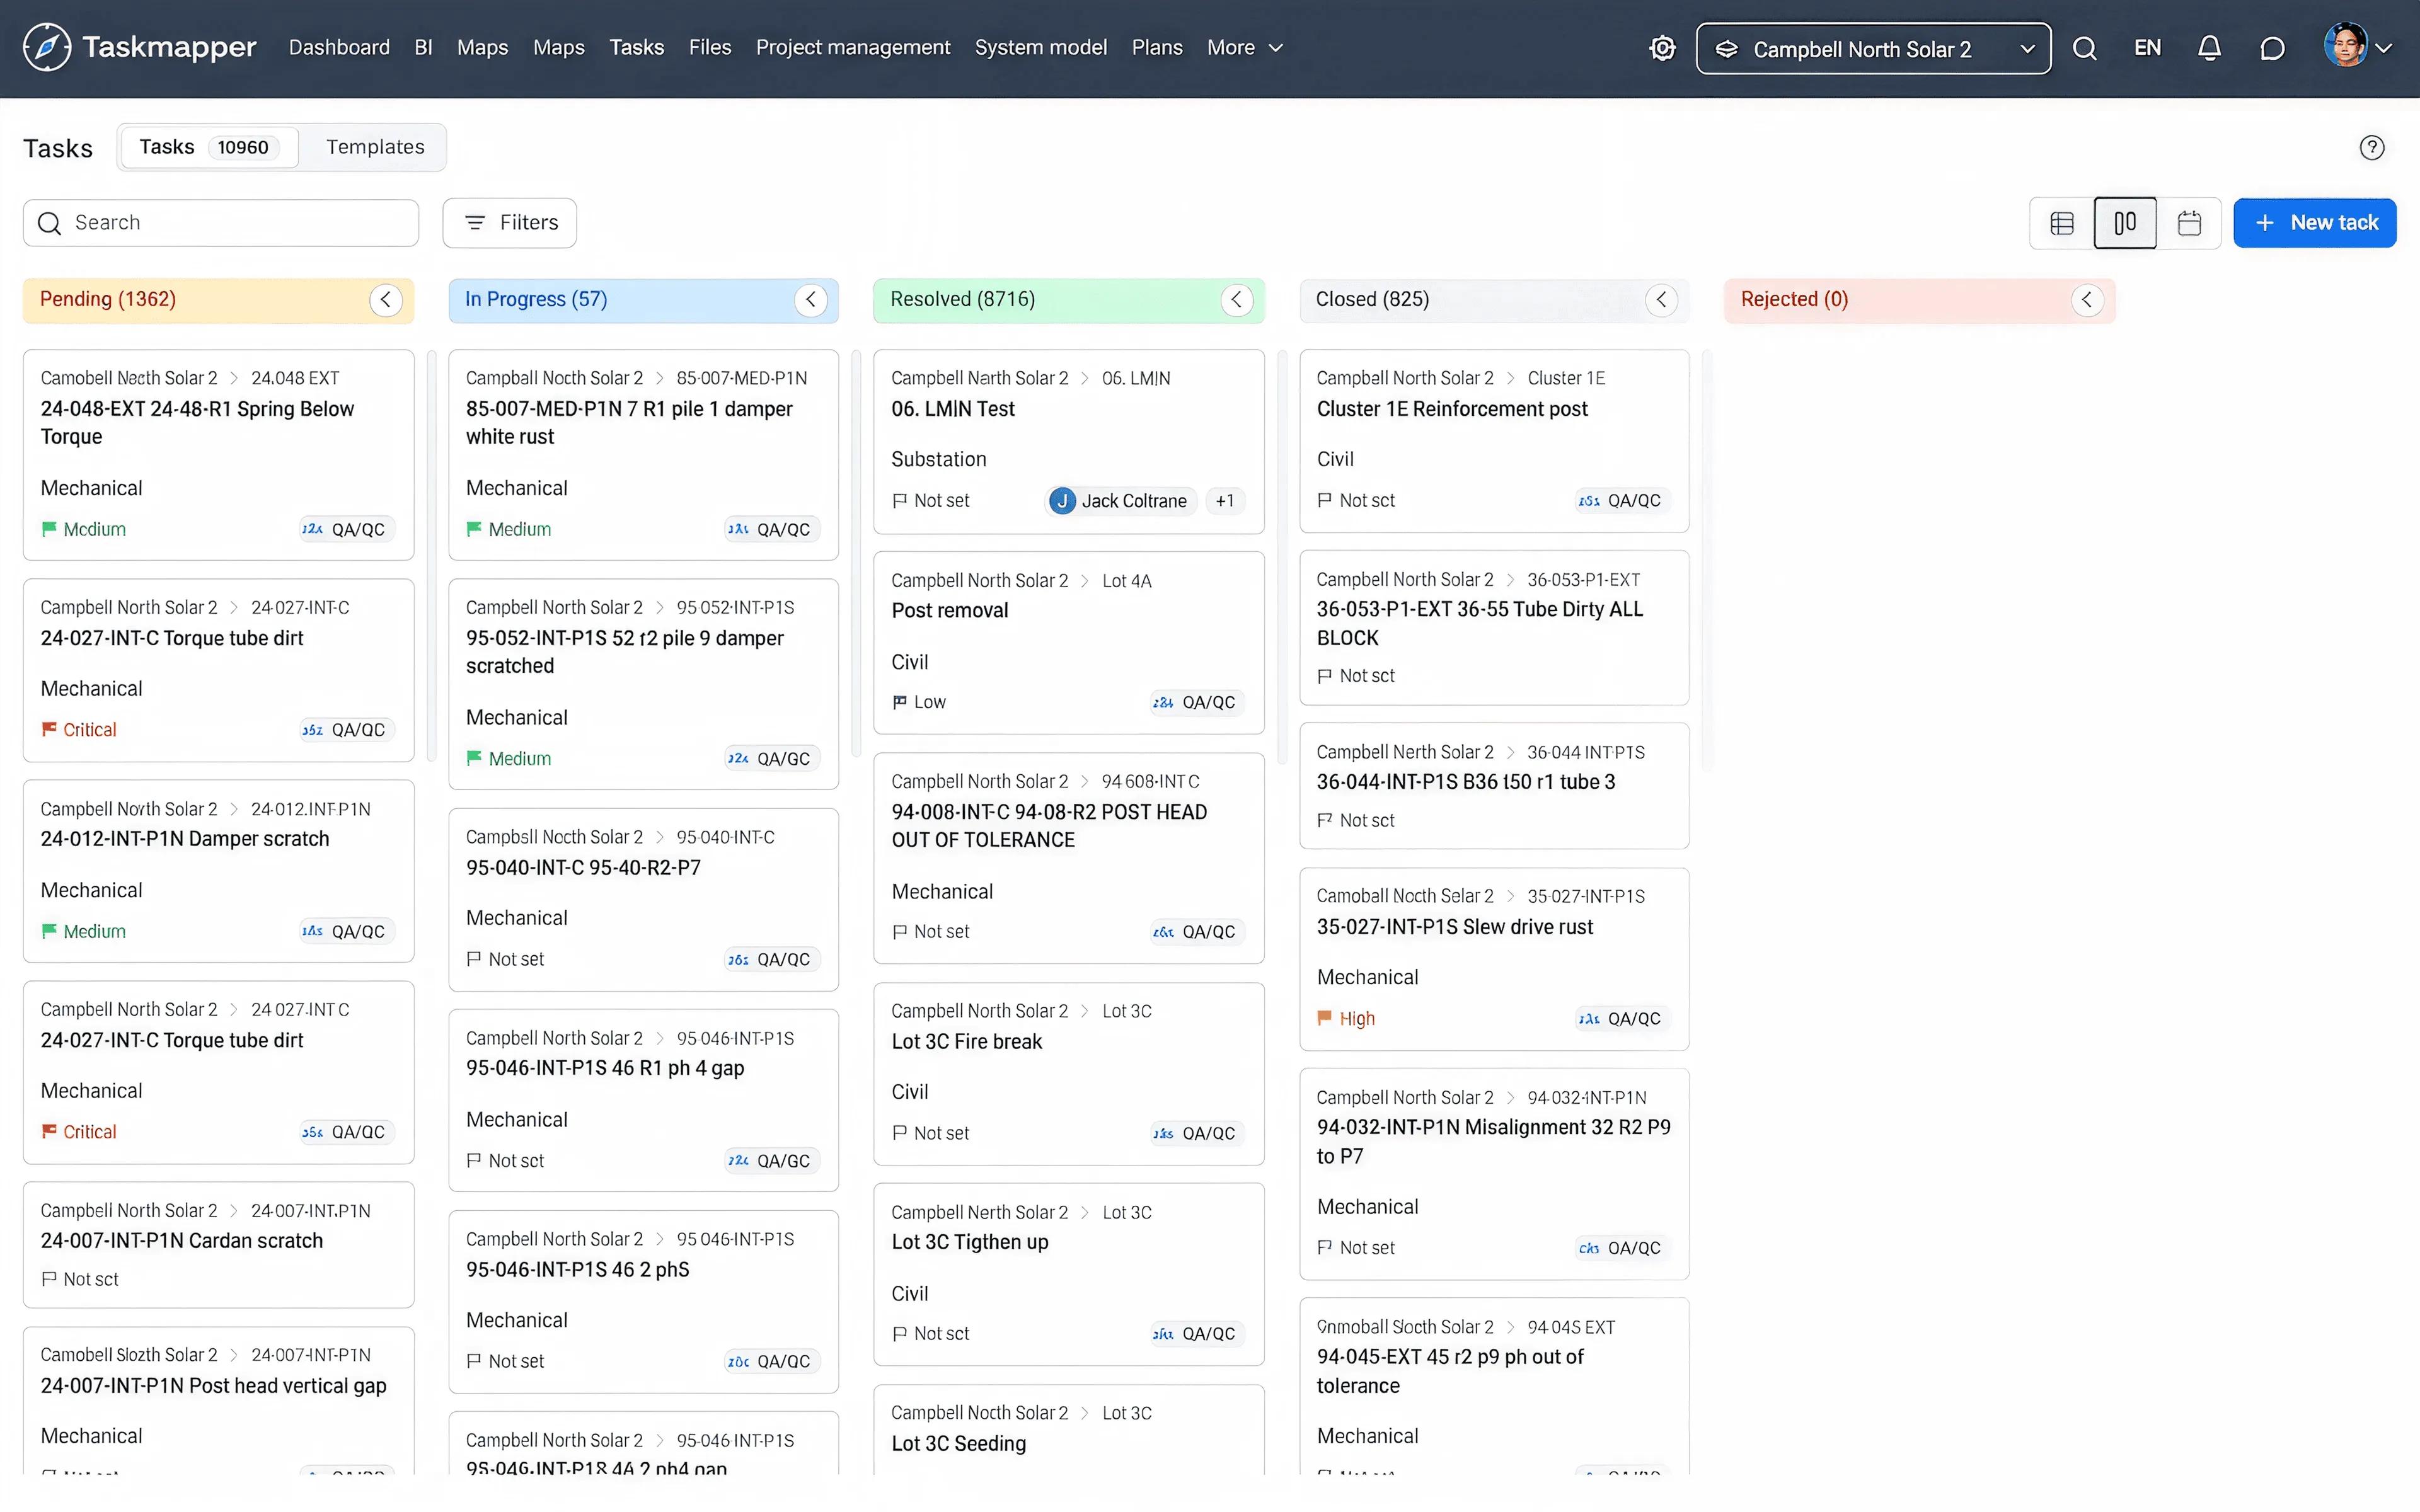
Tasks
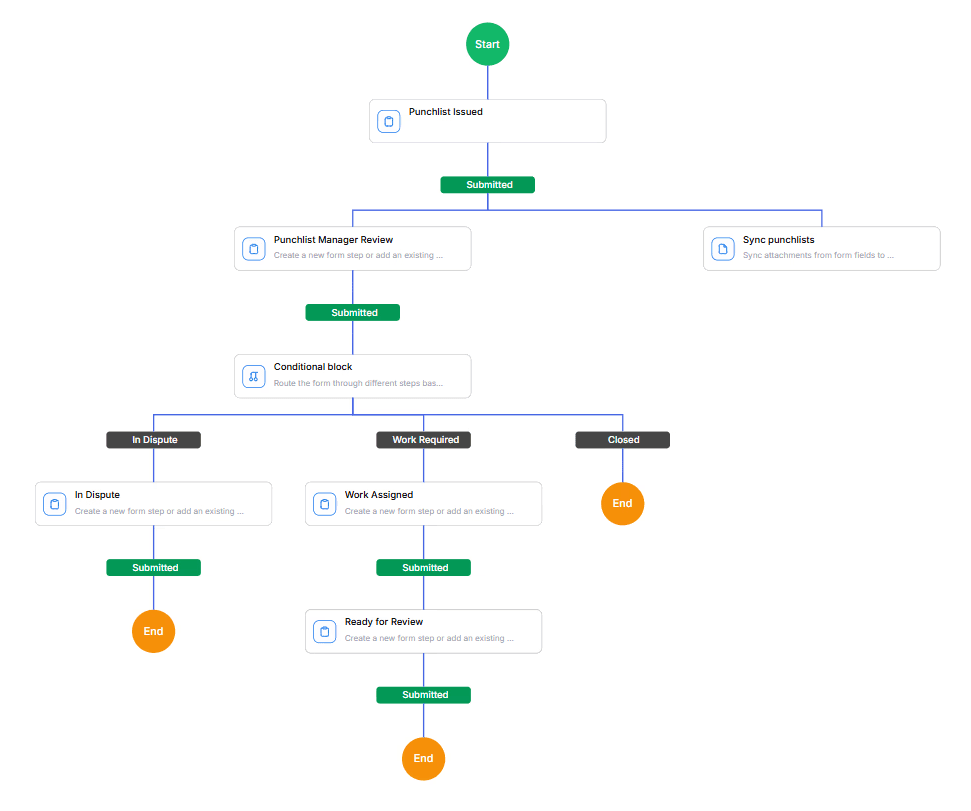
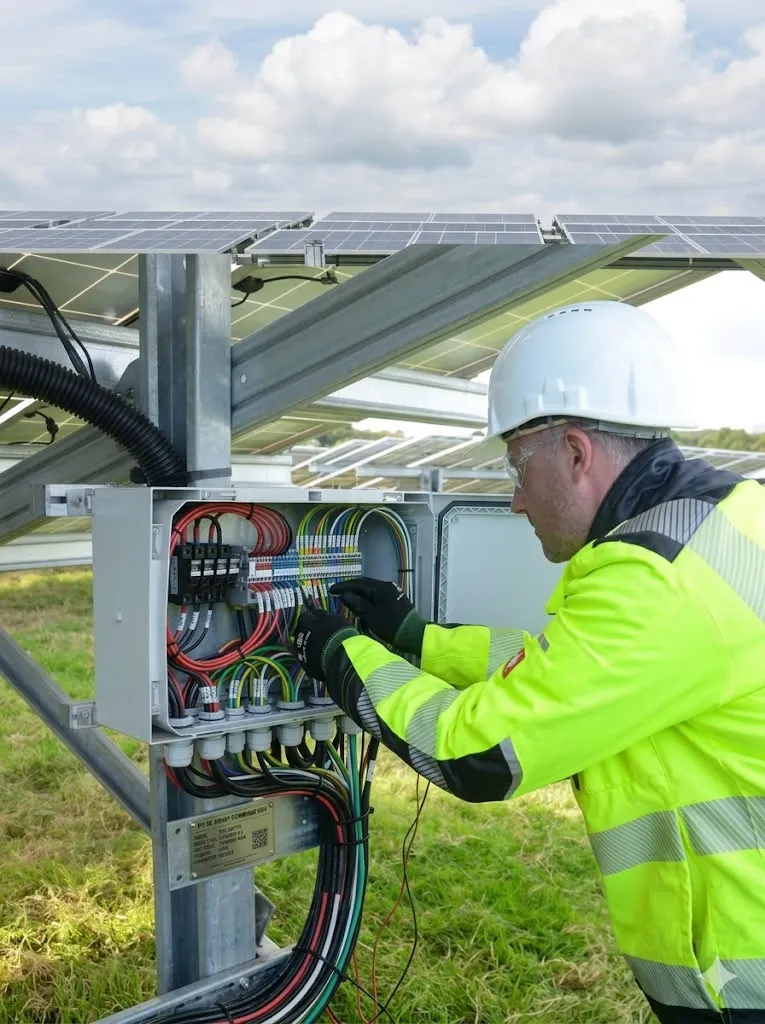
Forms & Workflows
Files & DMS
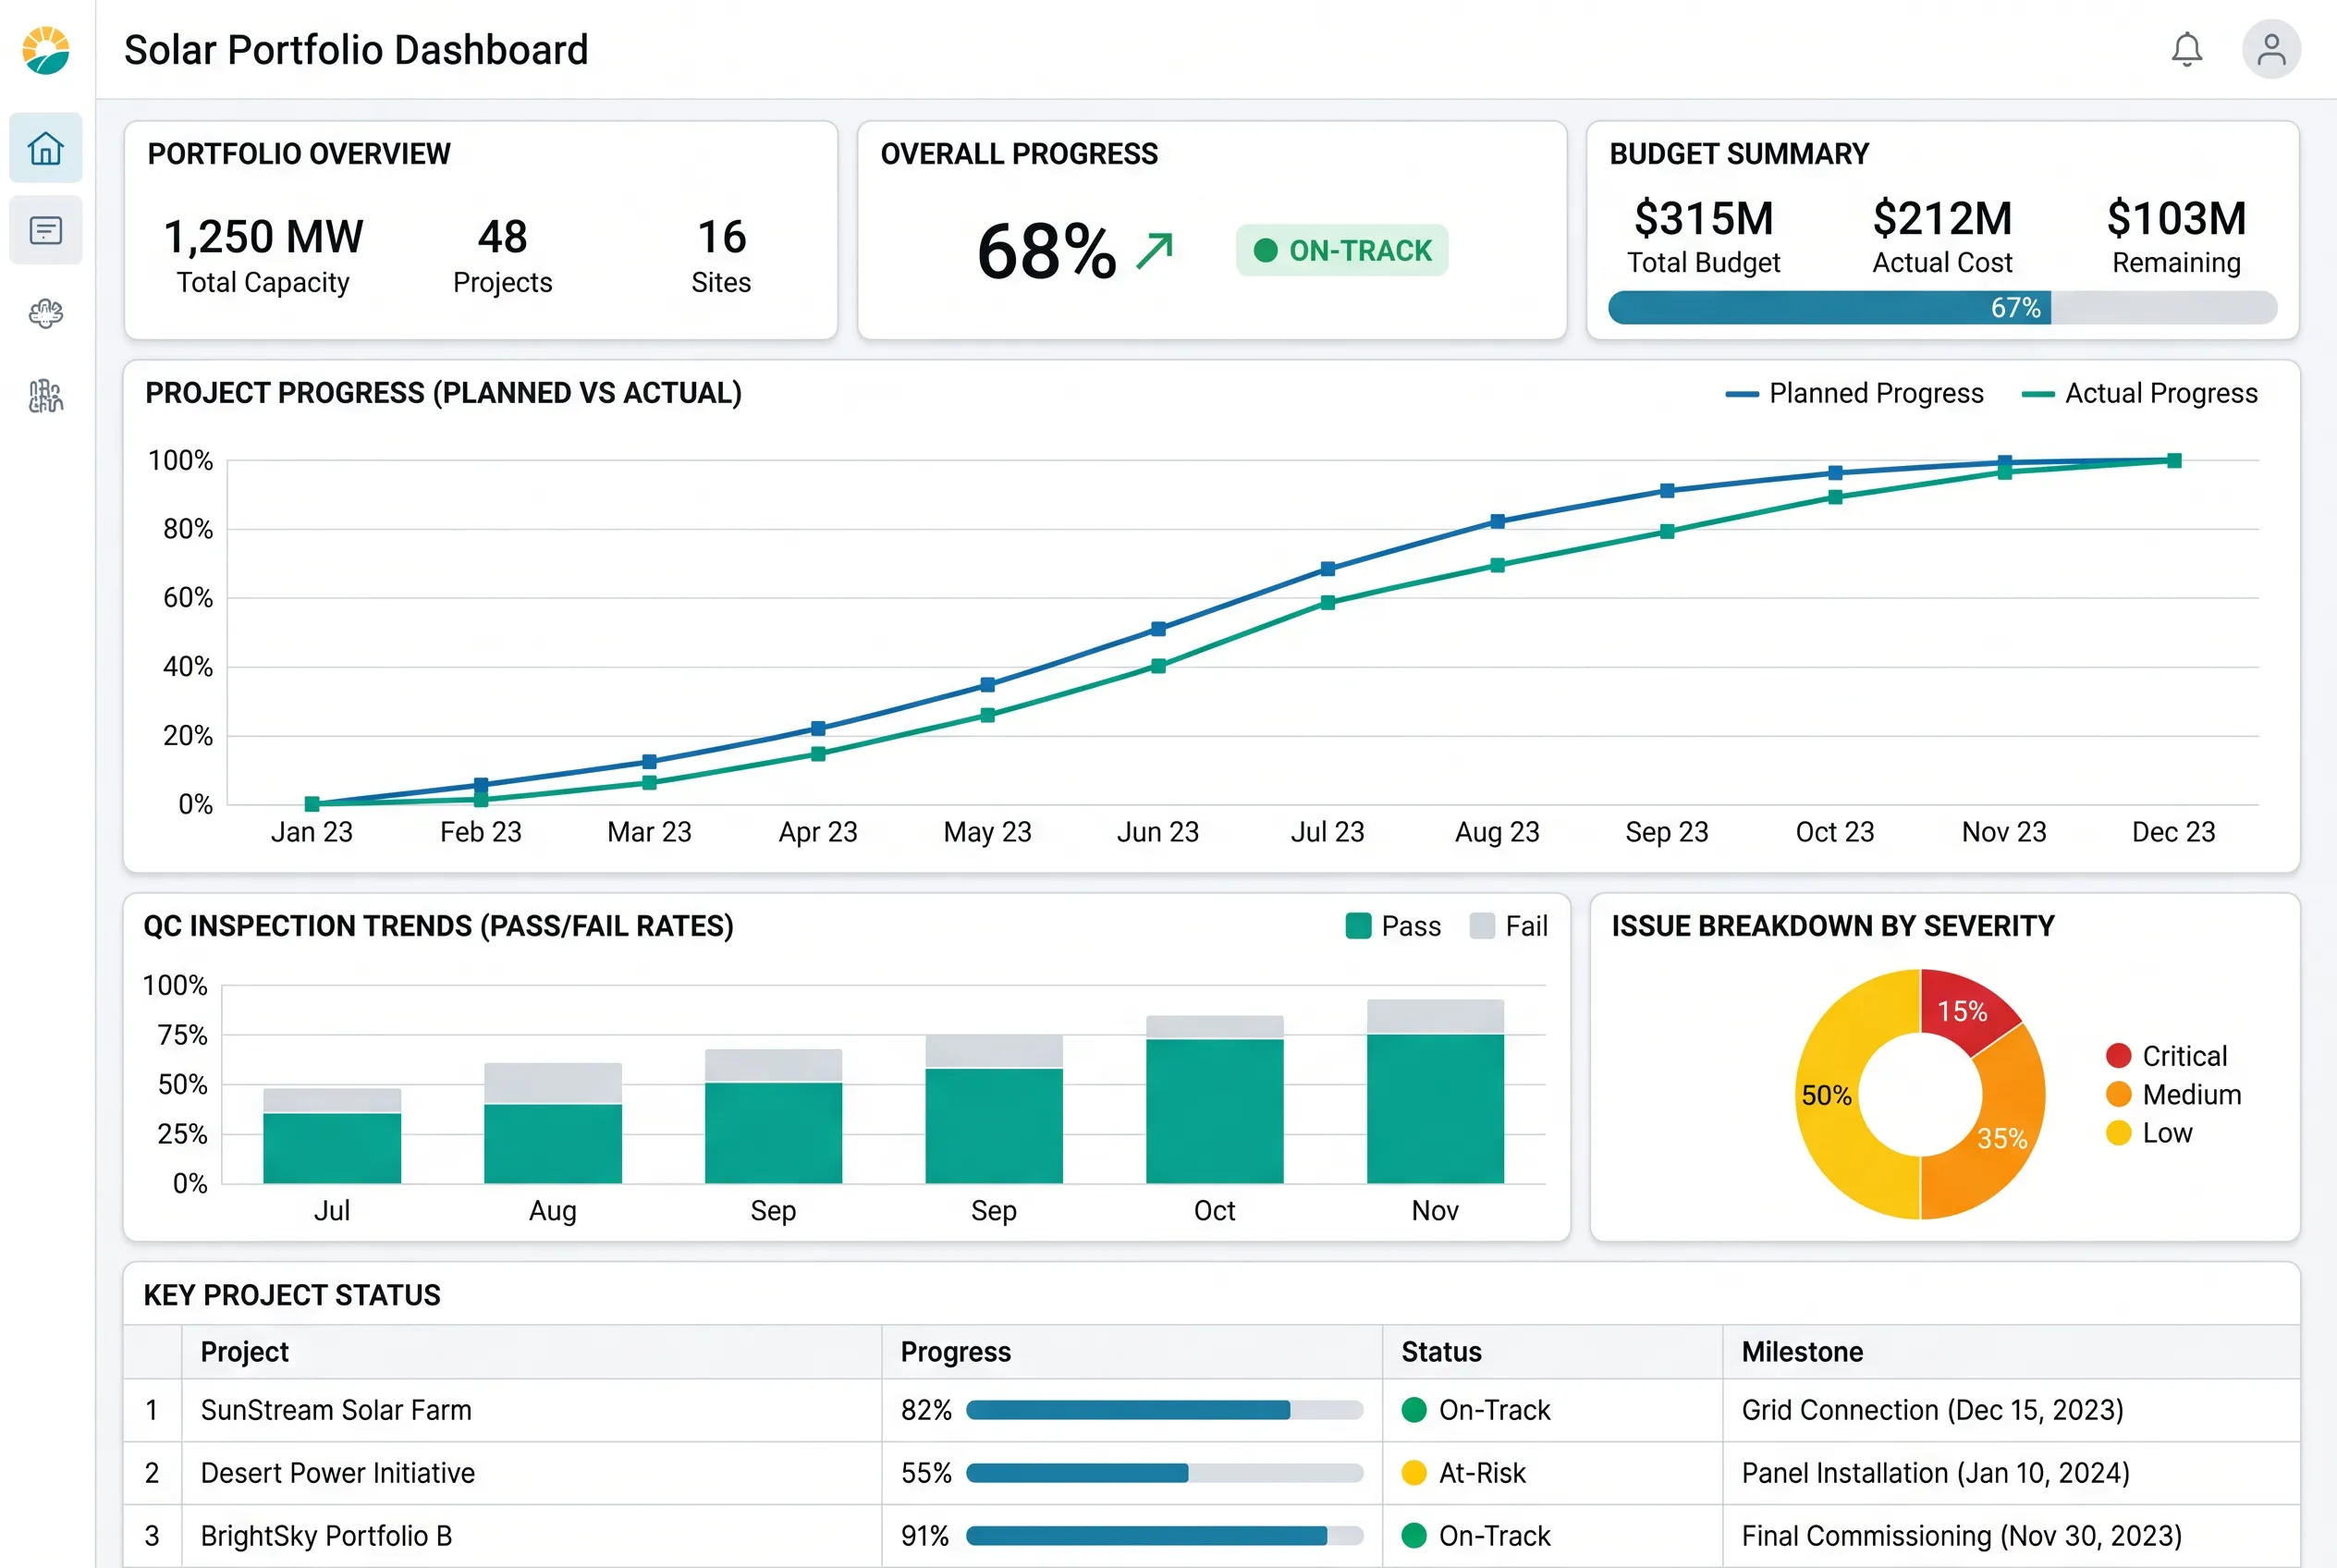
BI Dashboards
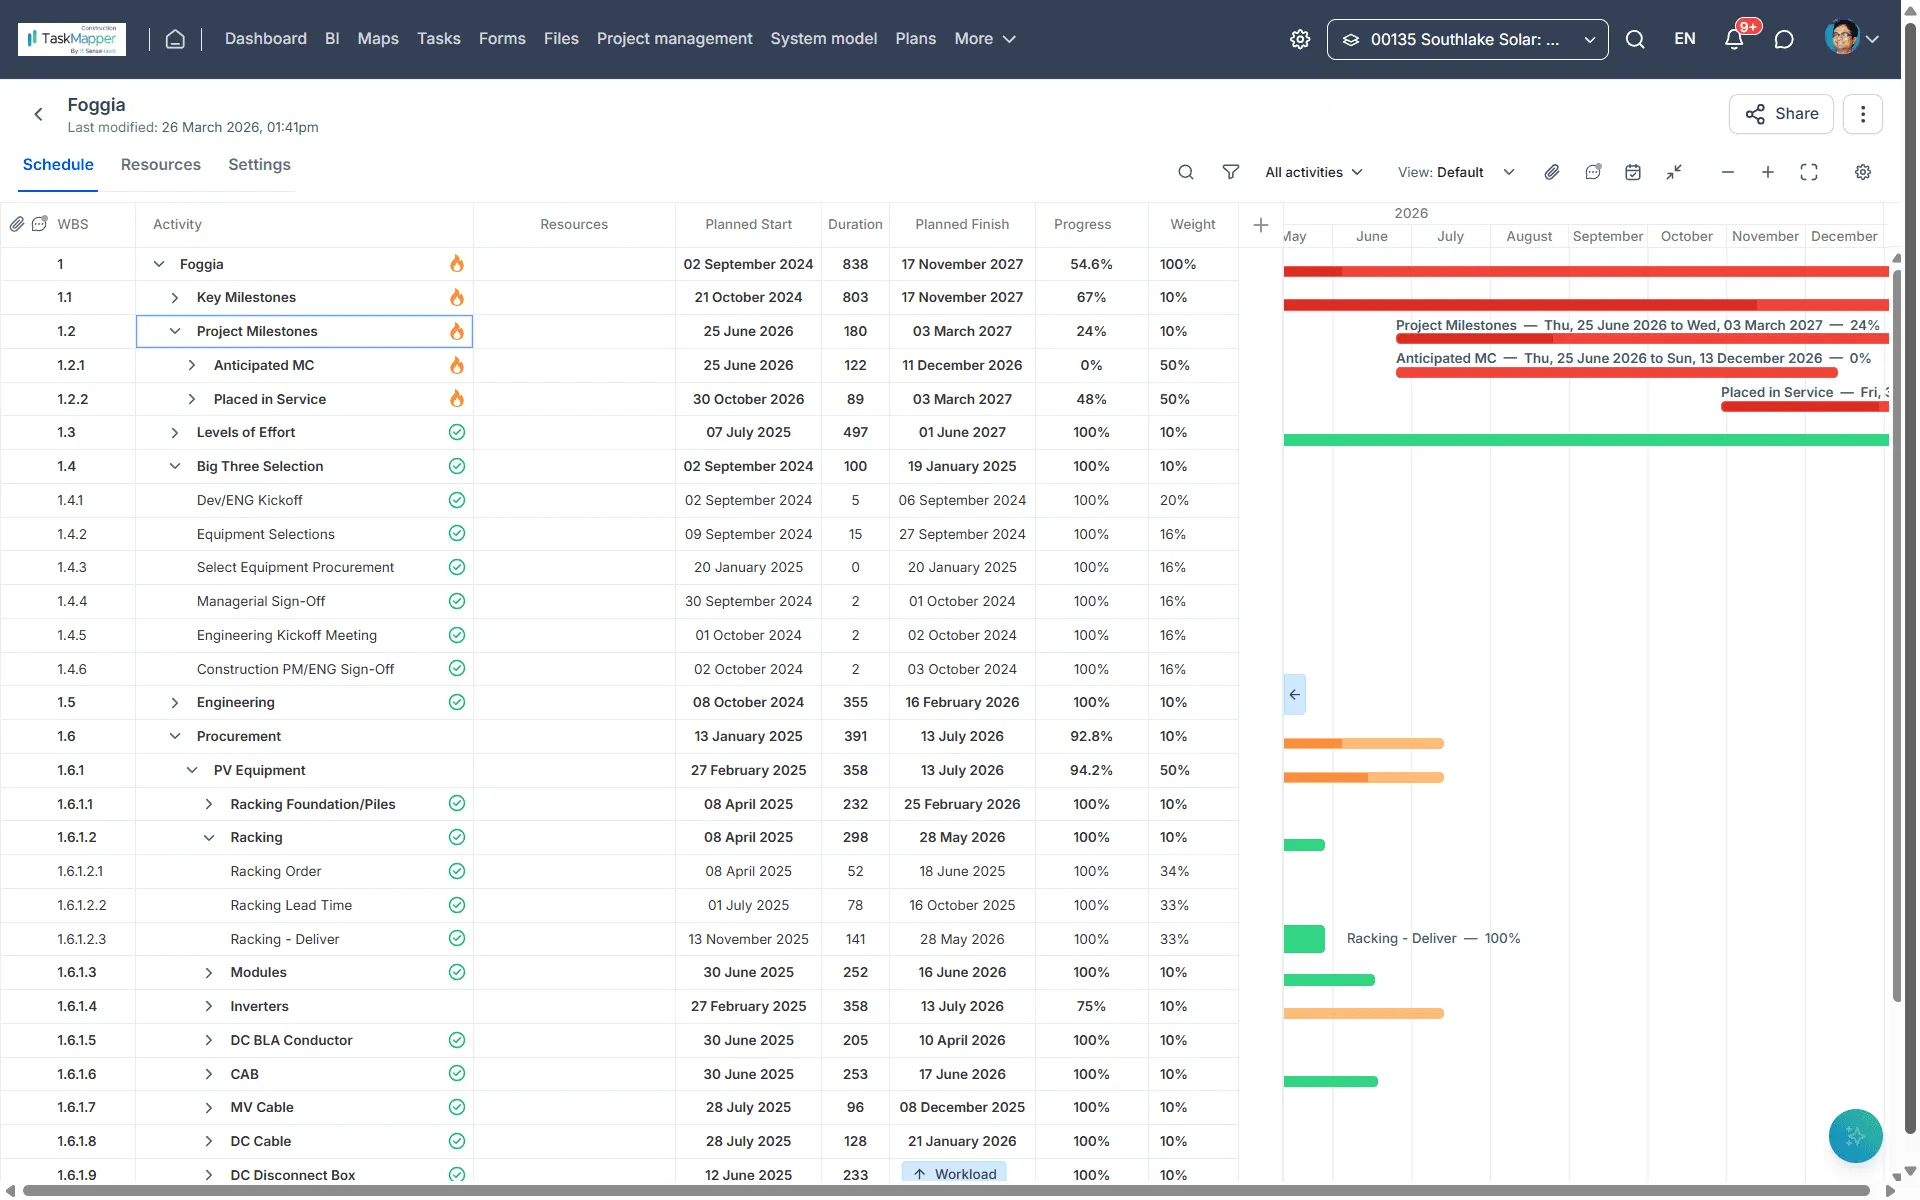
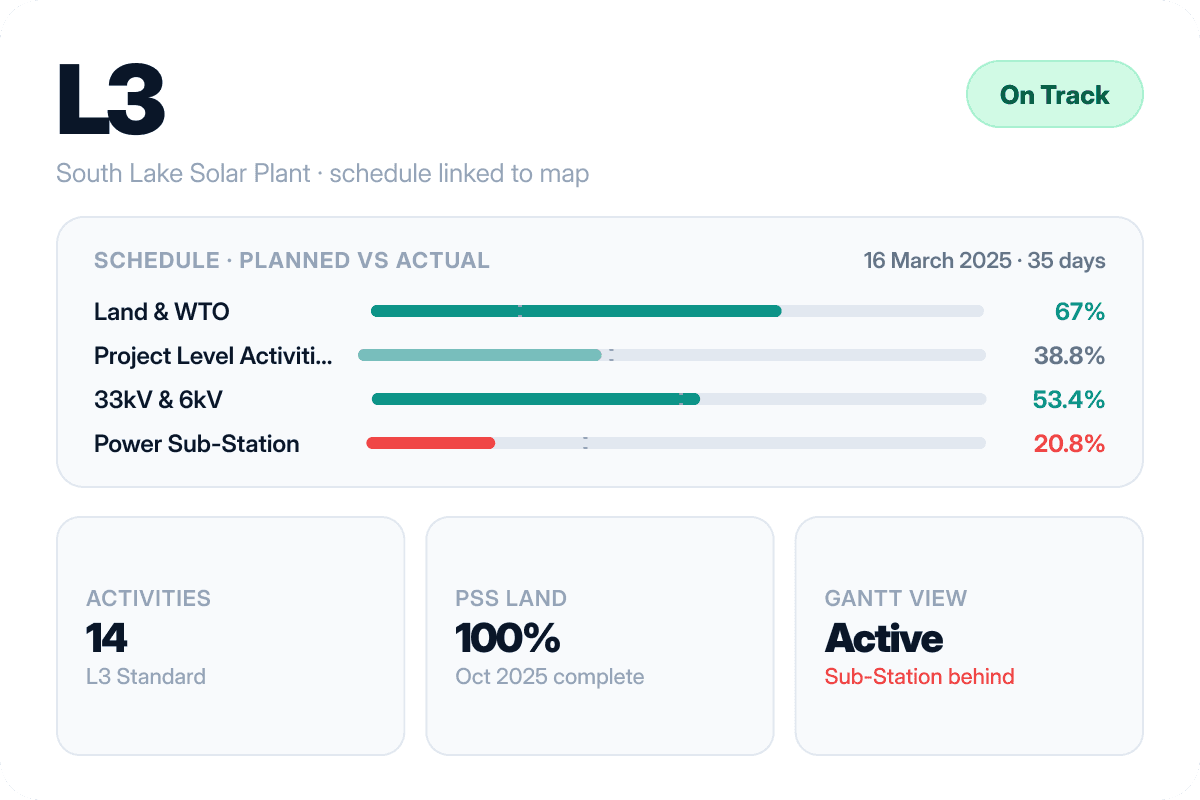
Project Management
Inventory
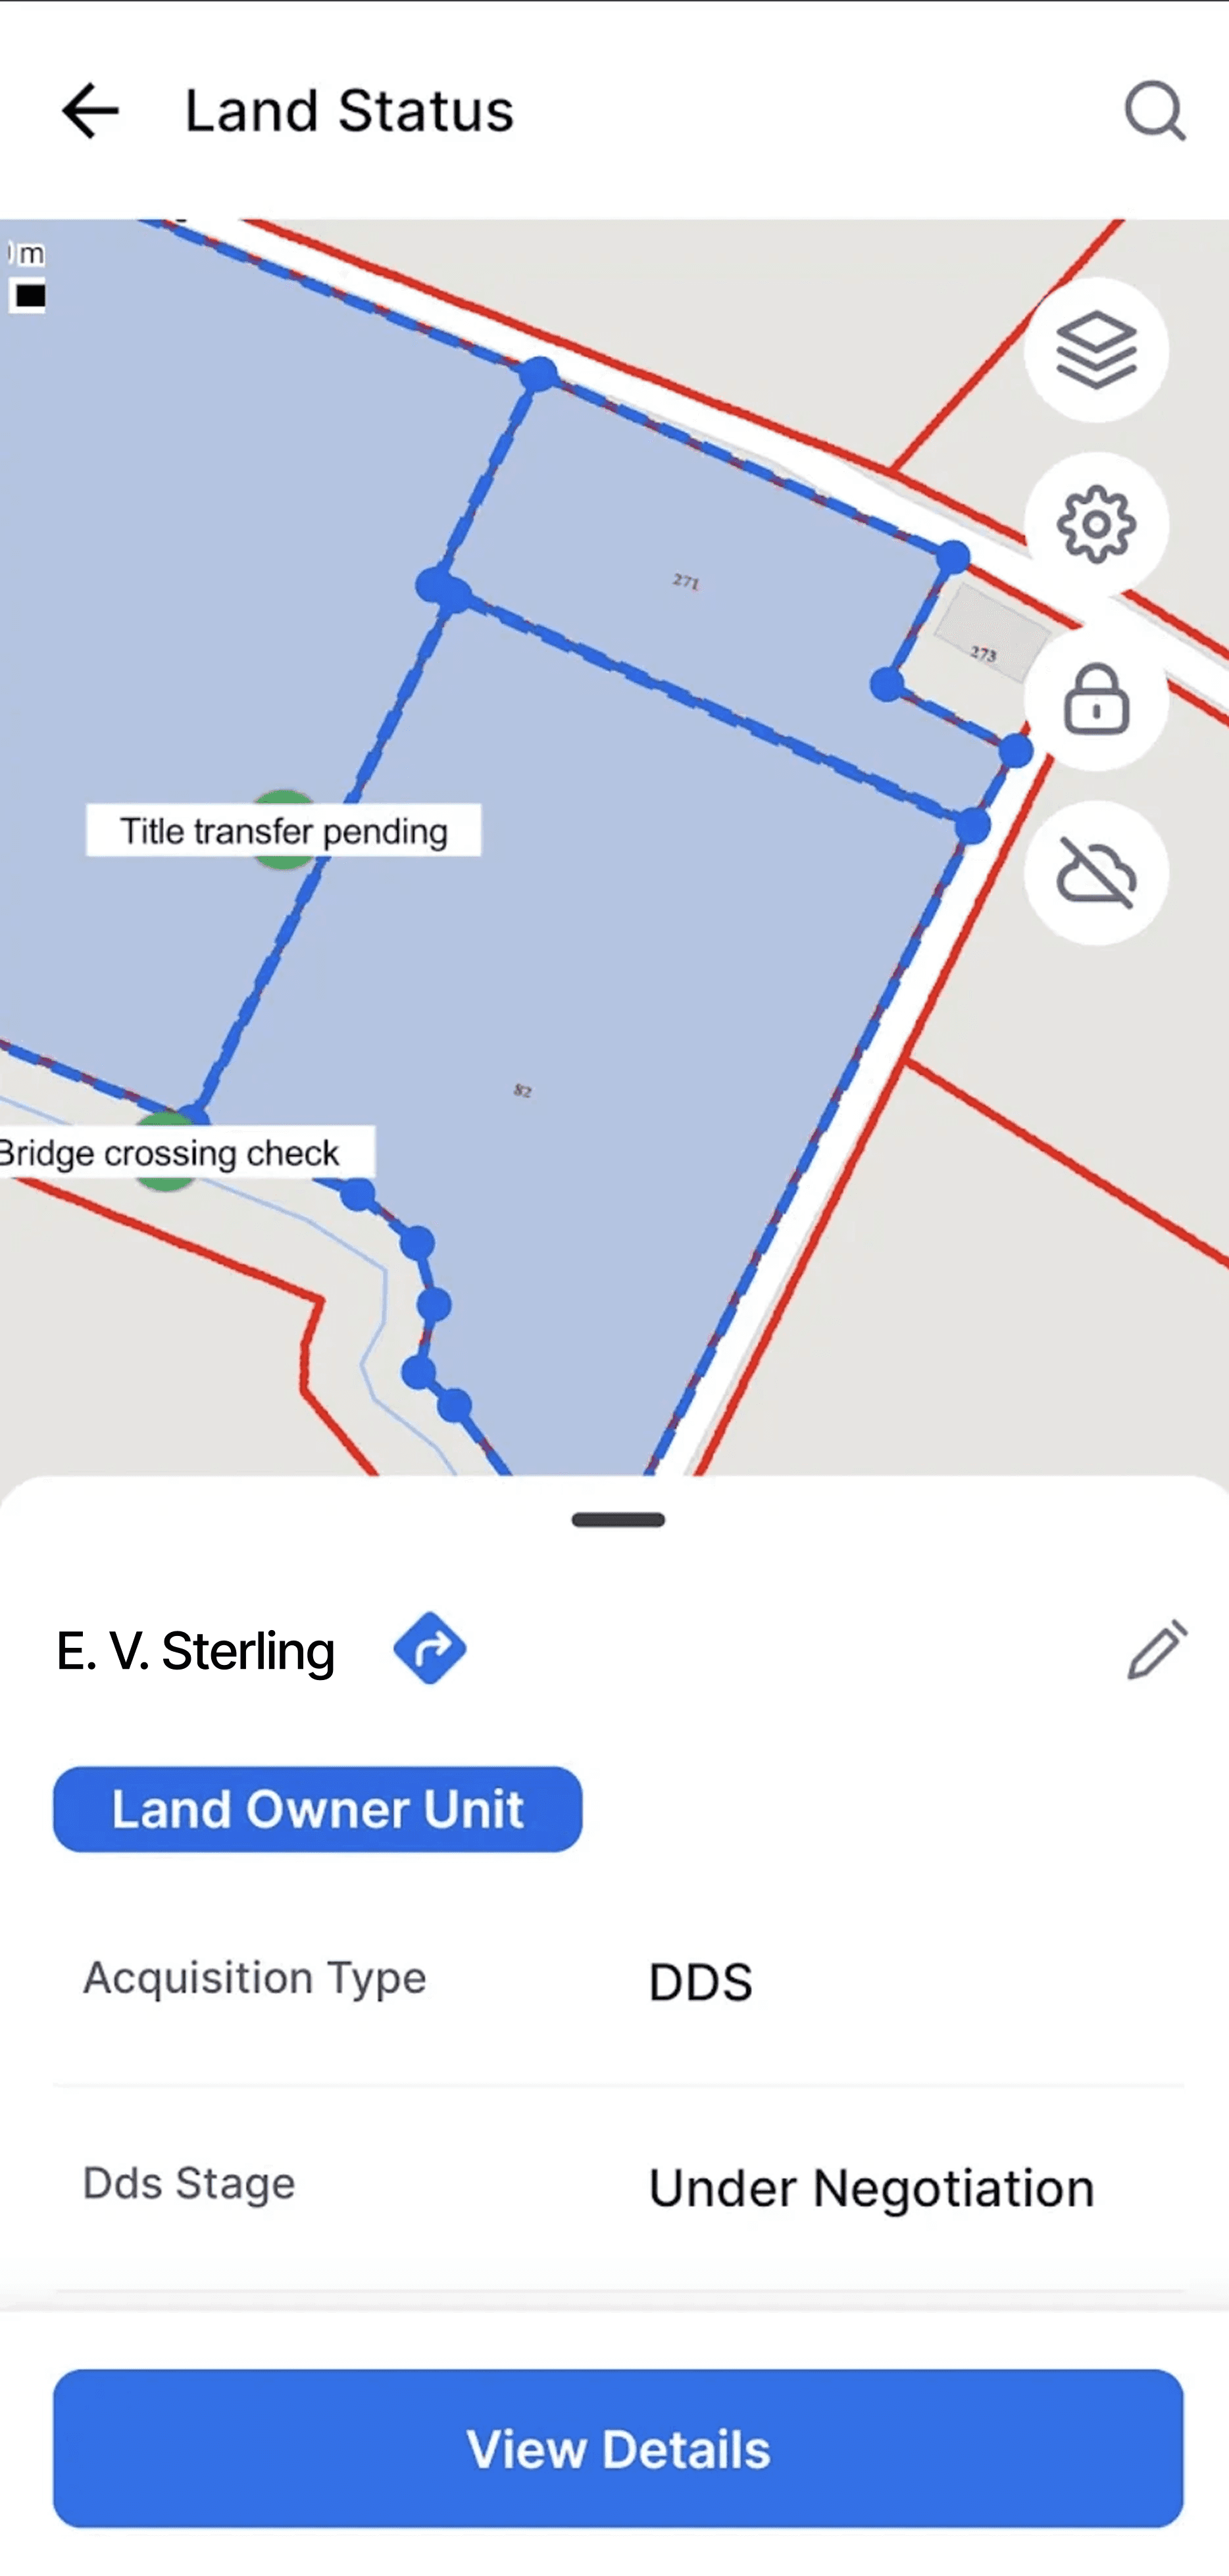
Mobile App
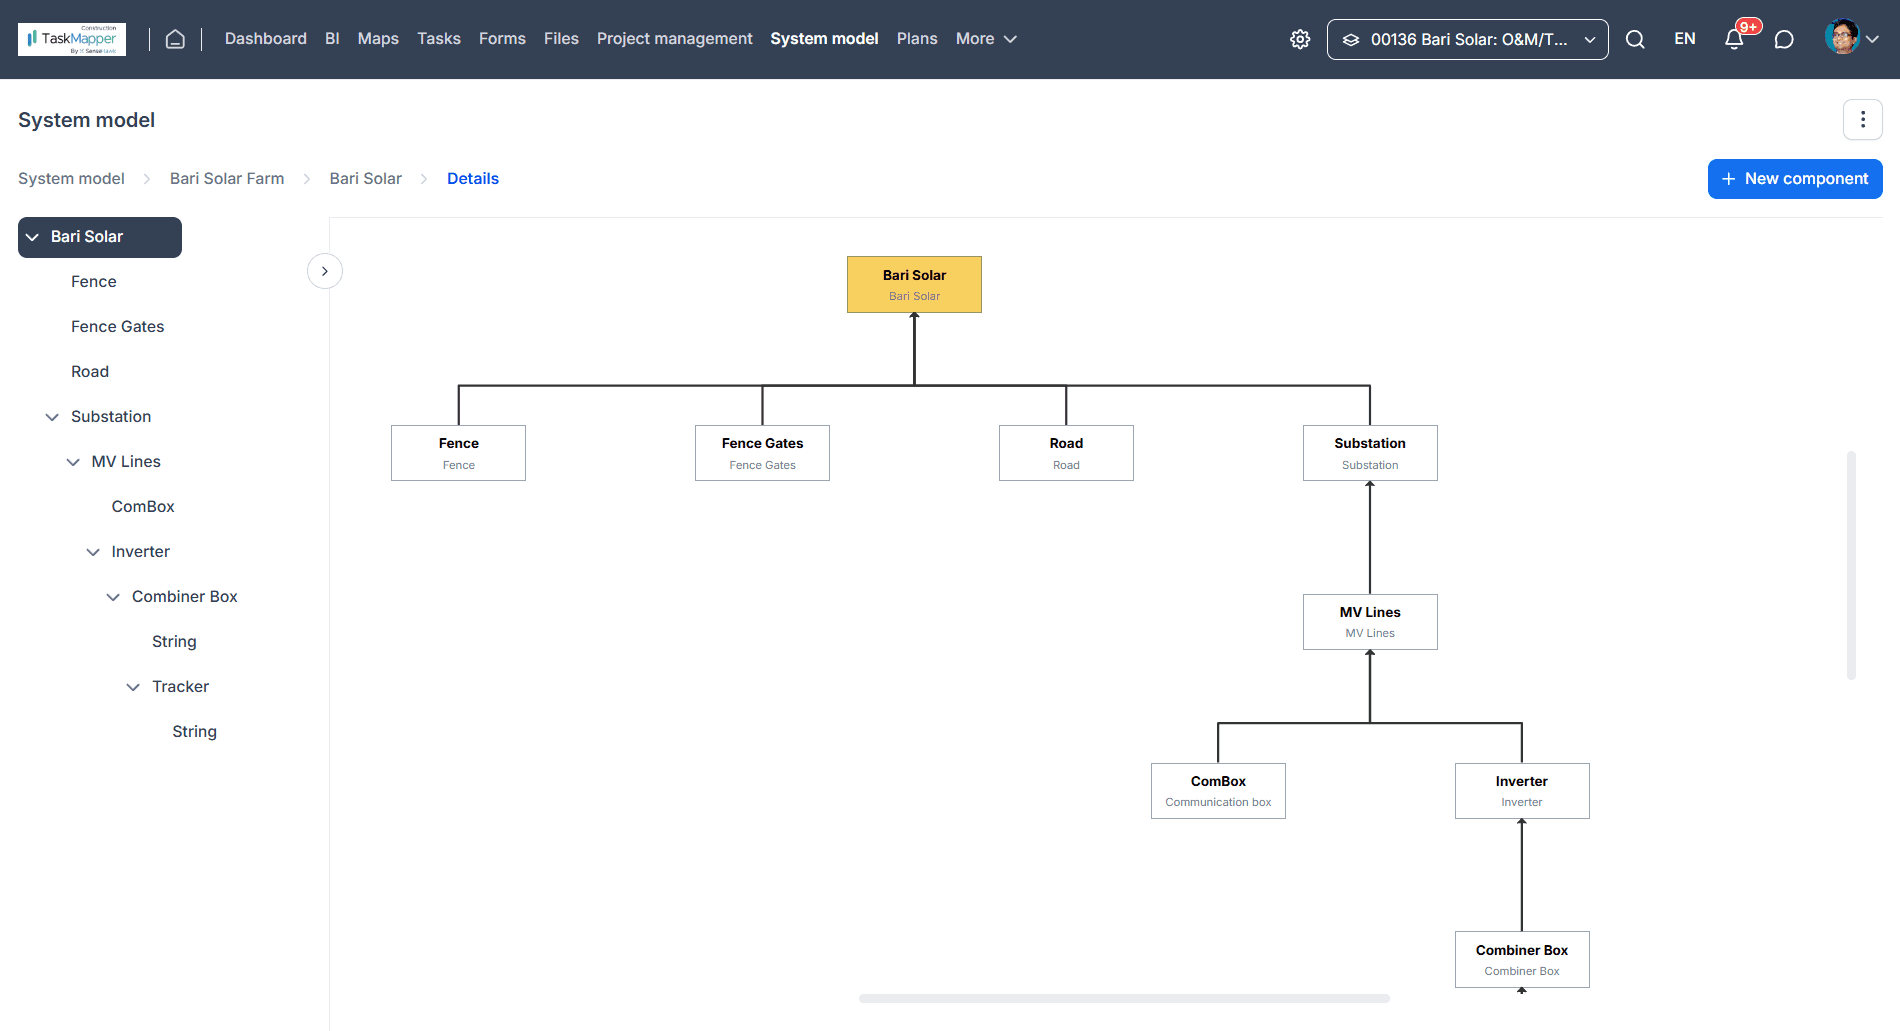
System Model
Drone Analytics
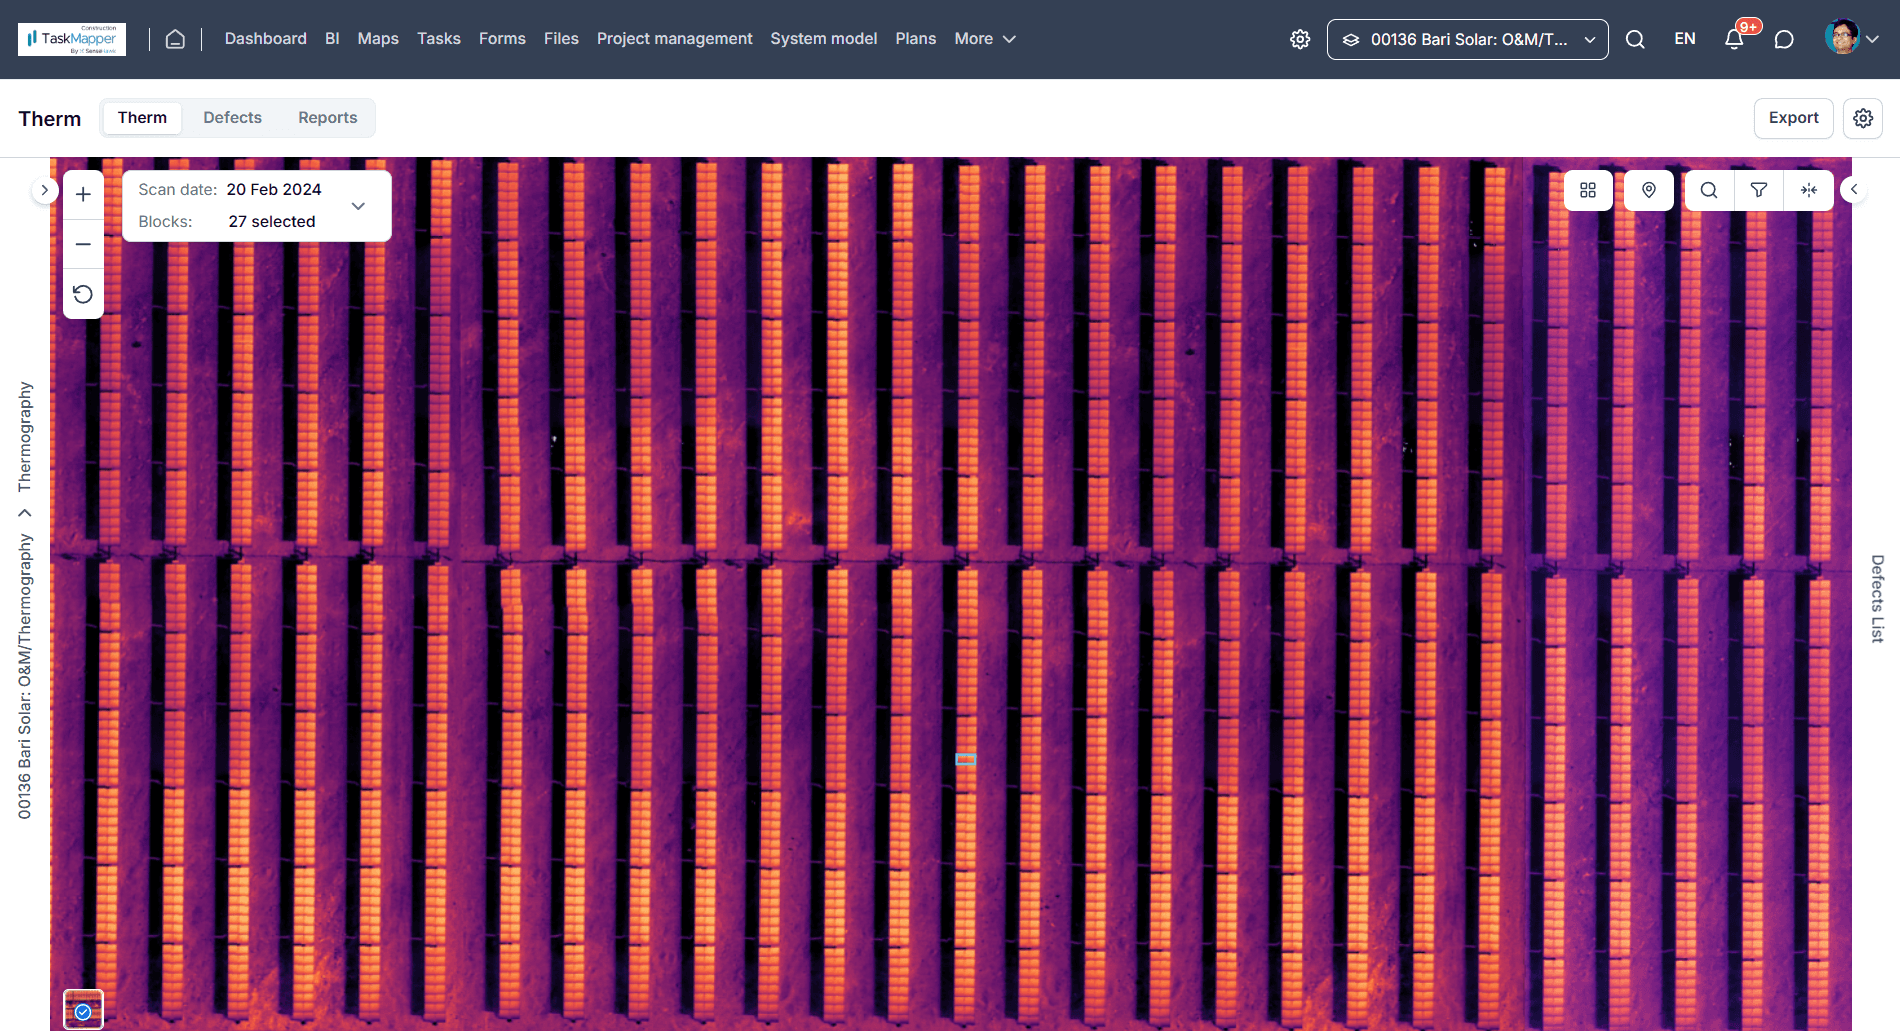
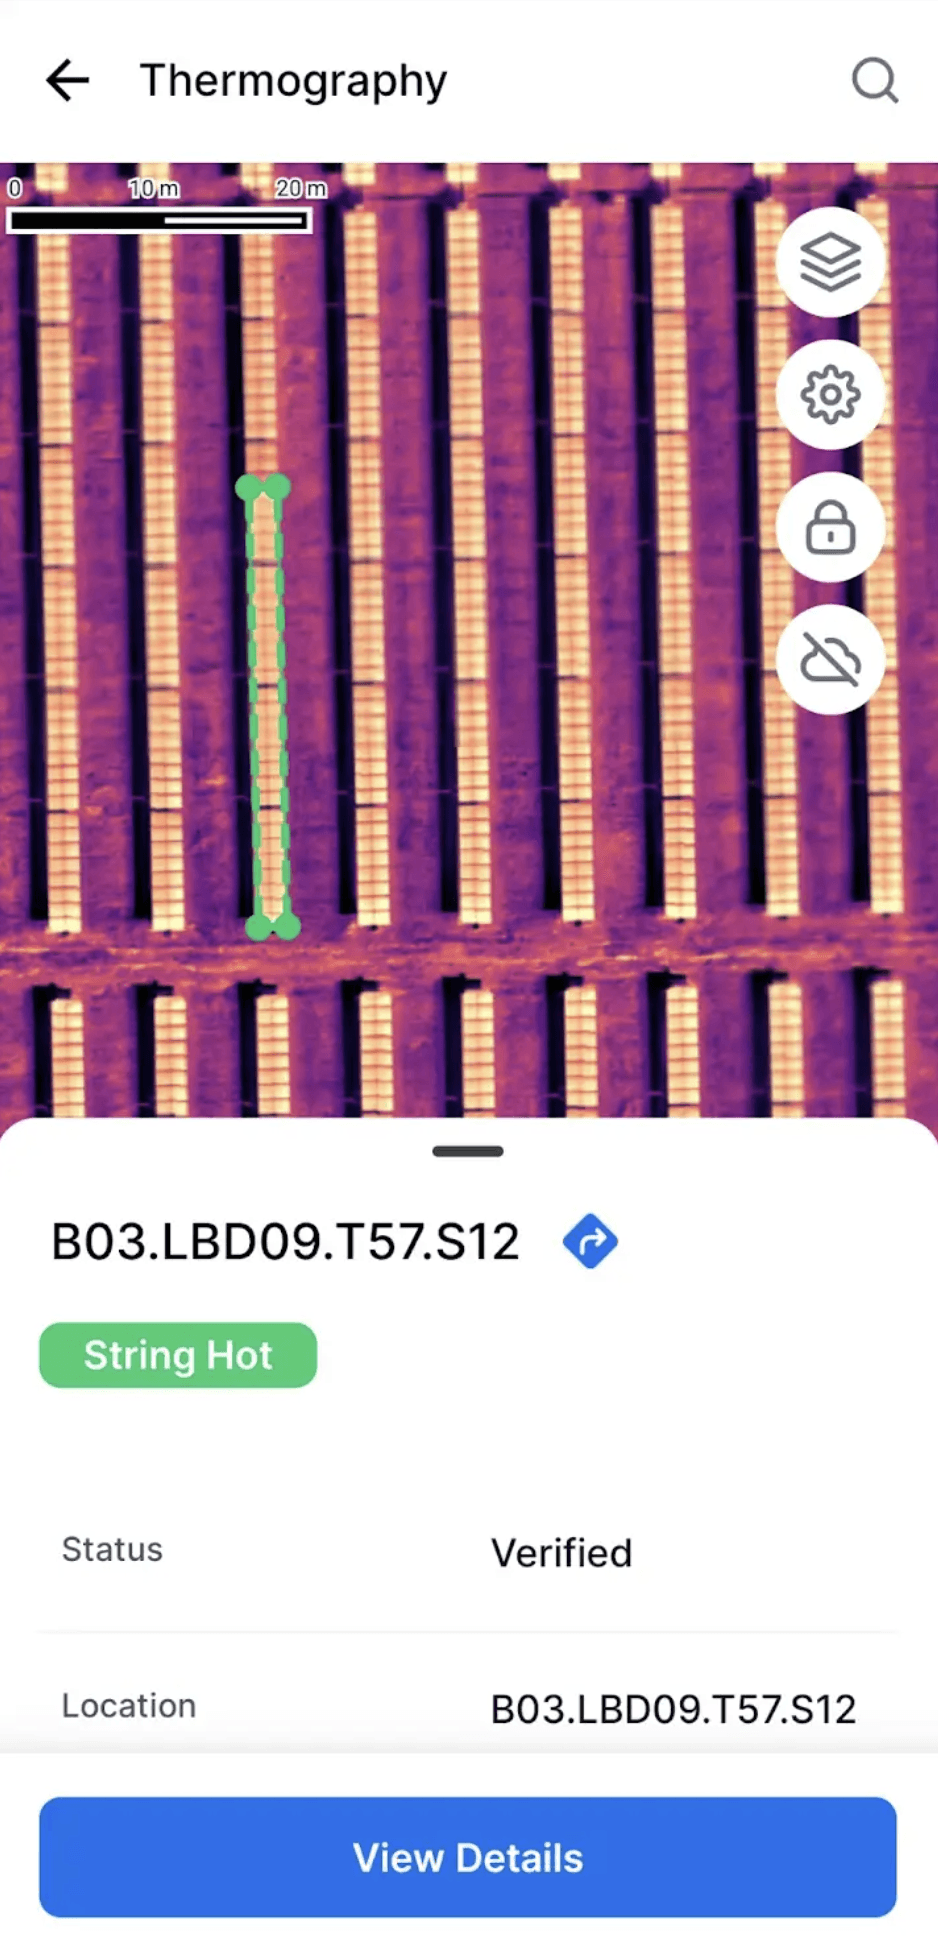
Therm
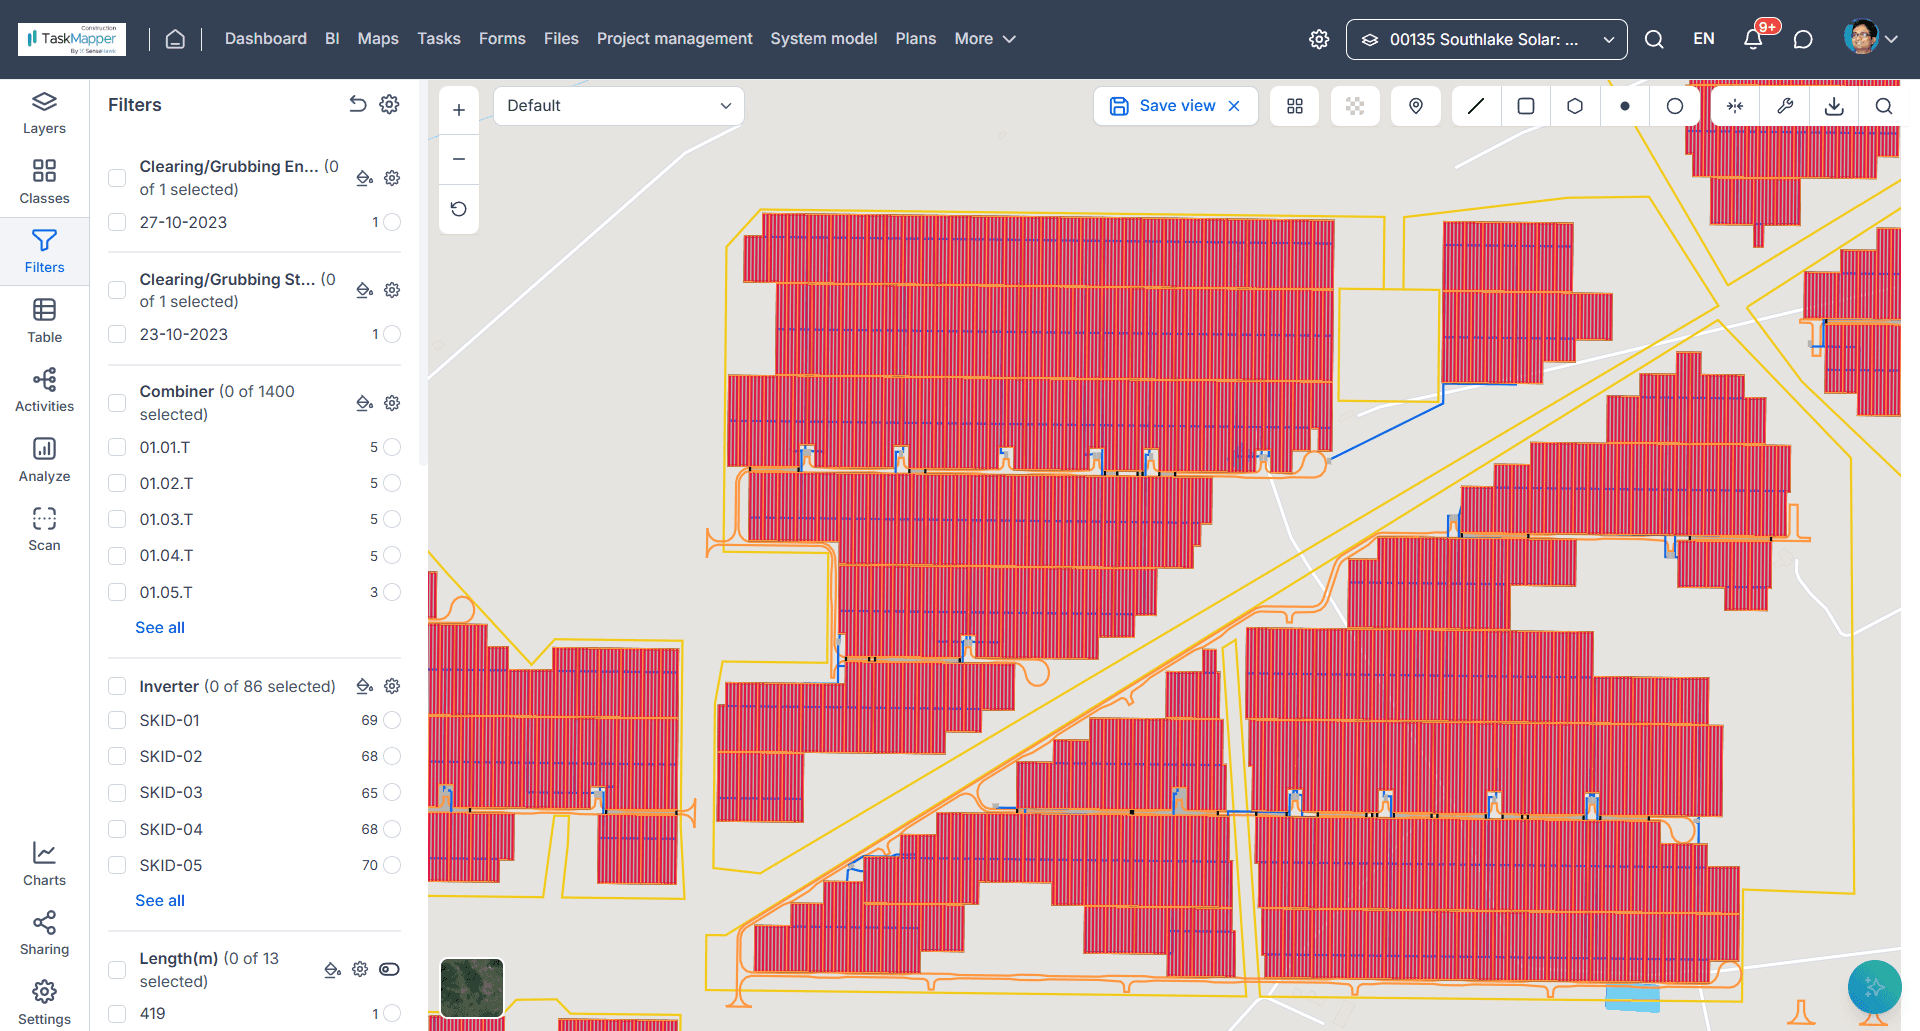
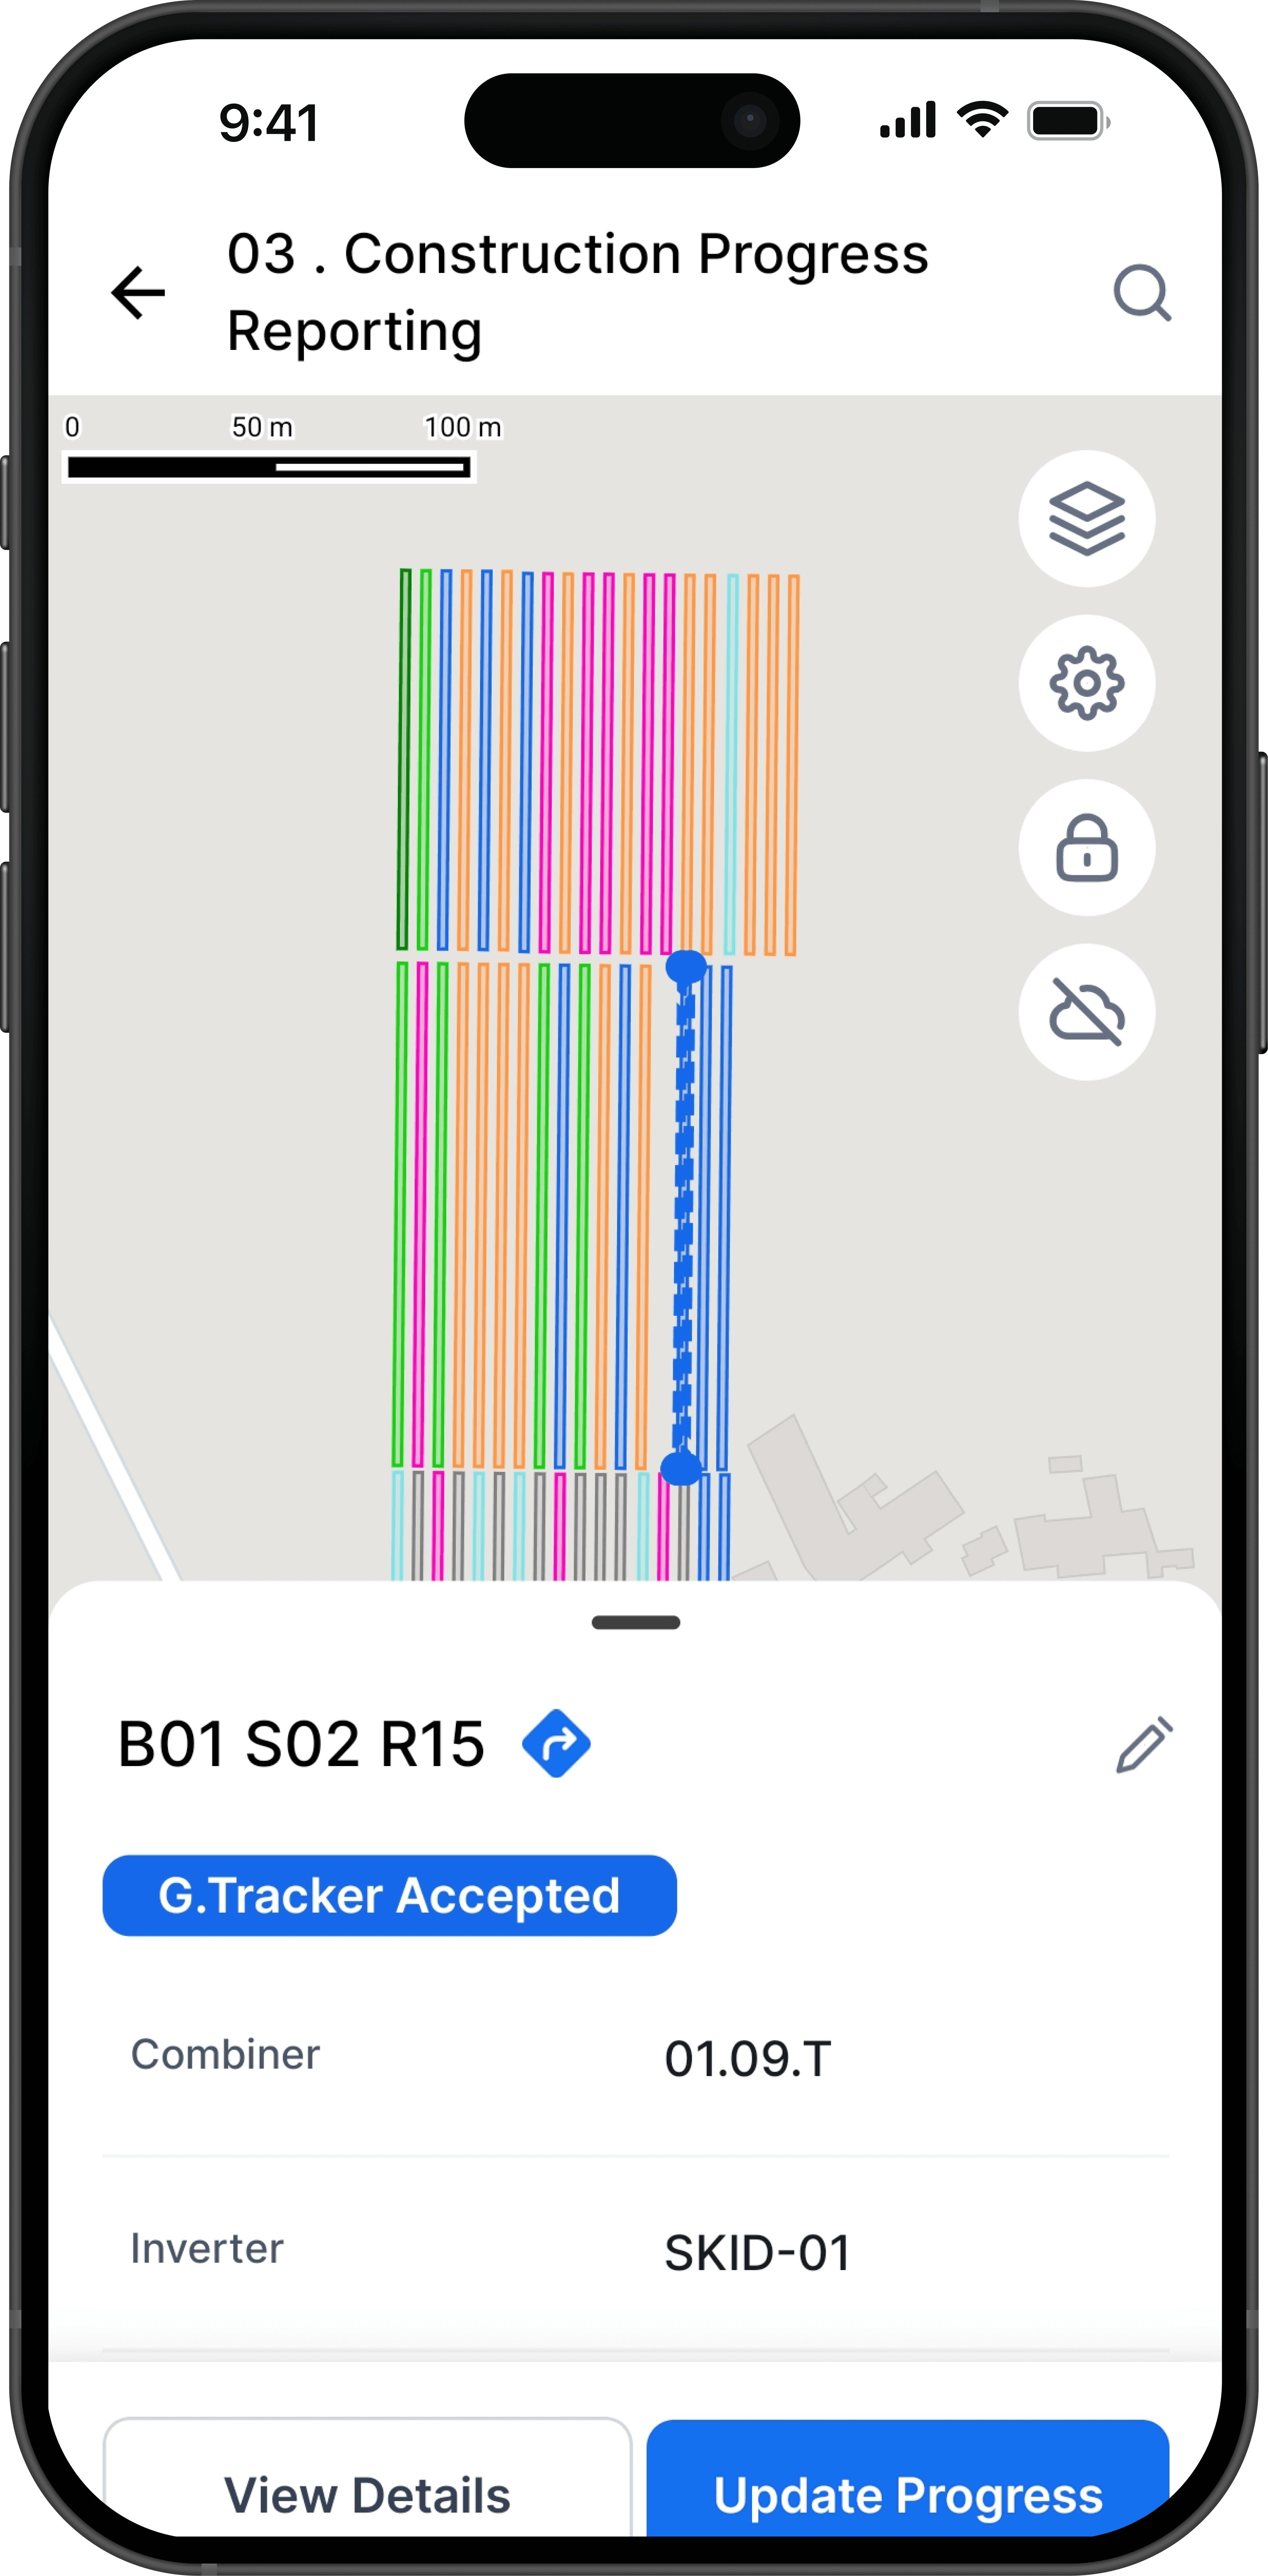
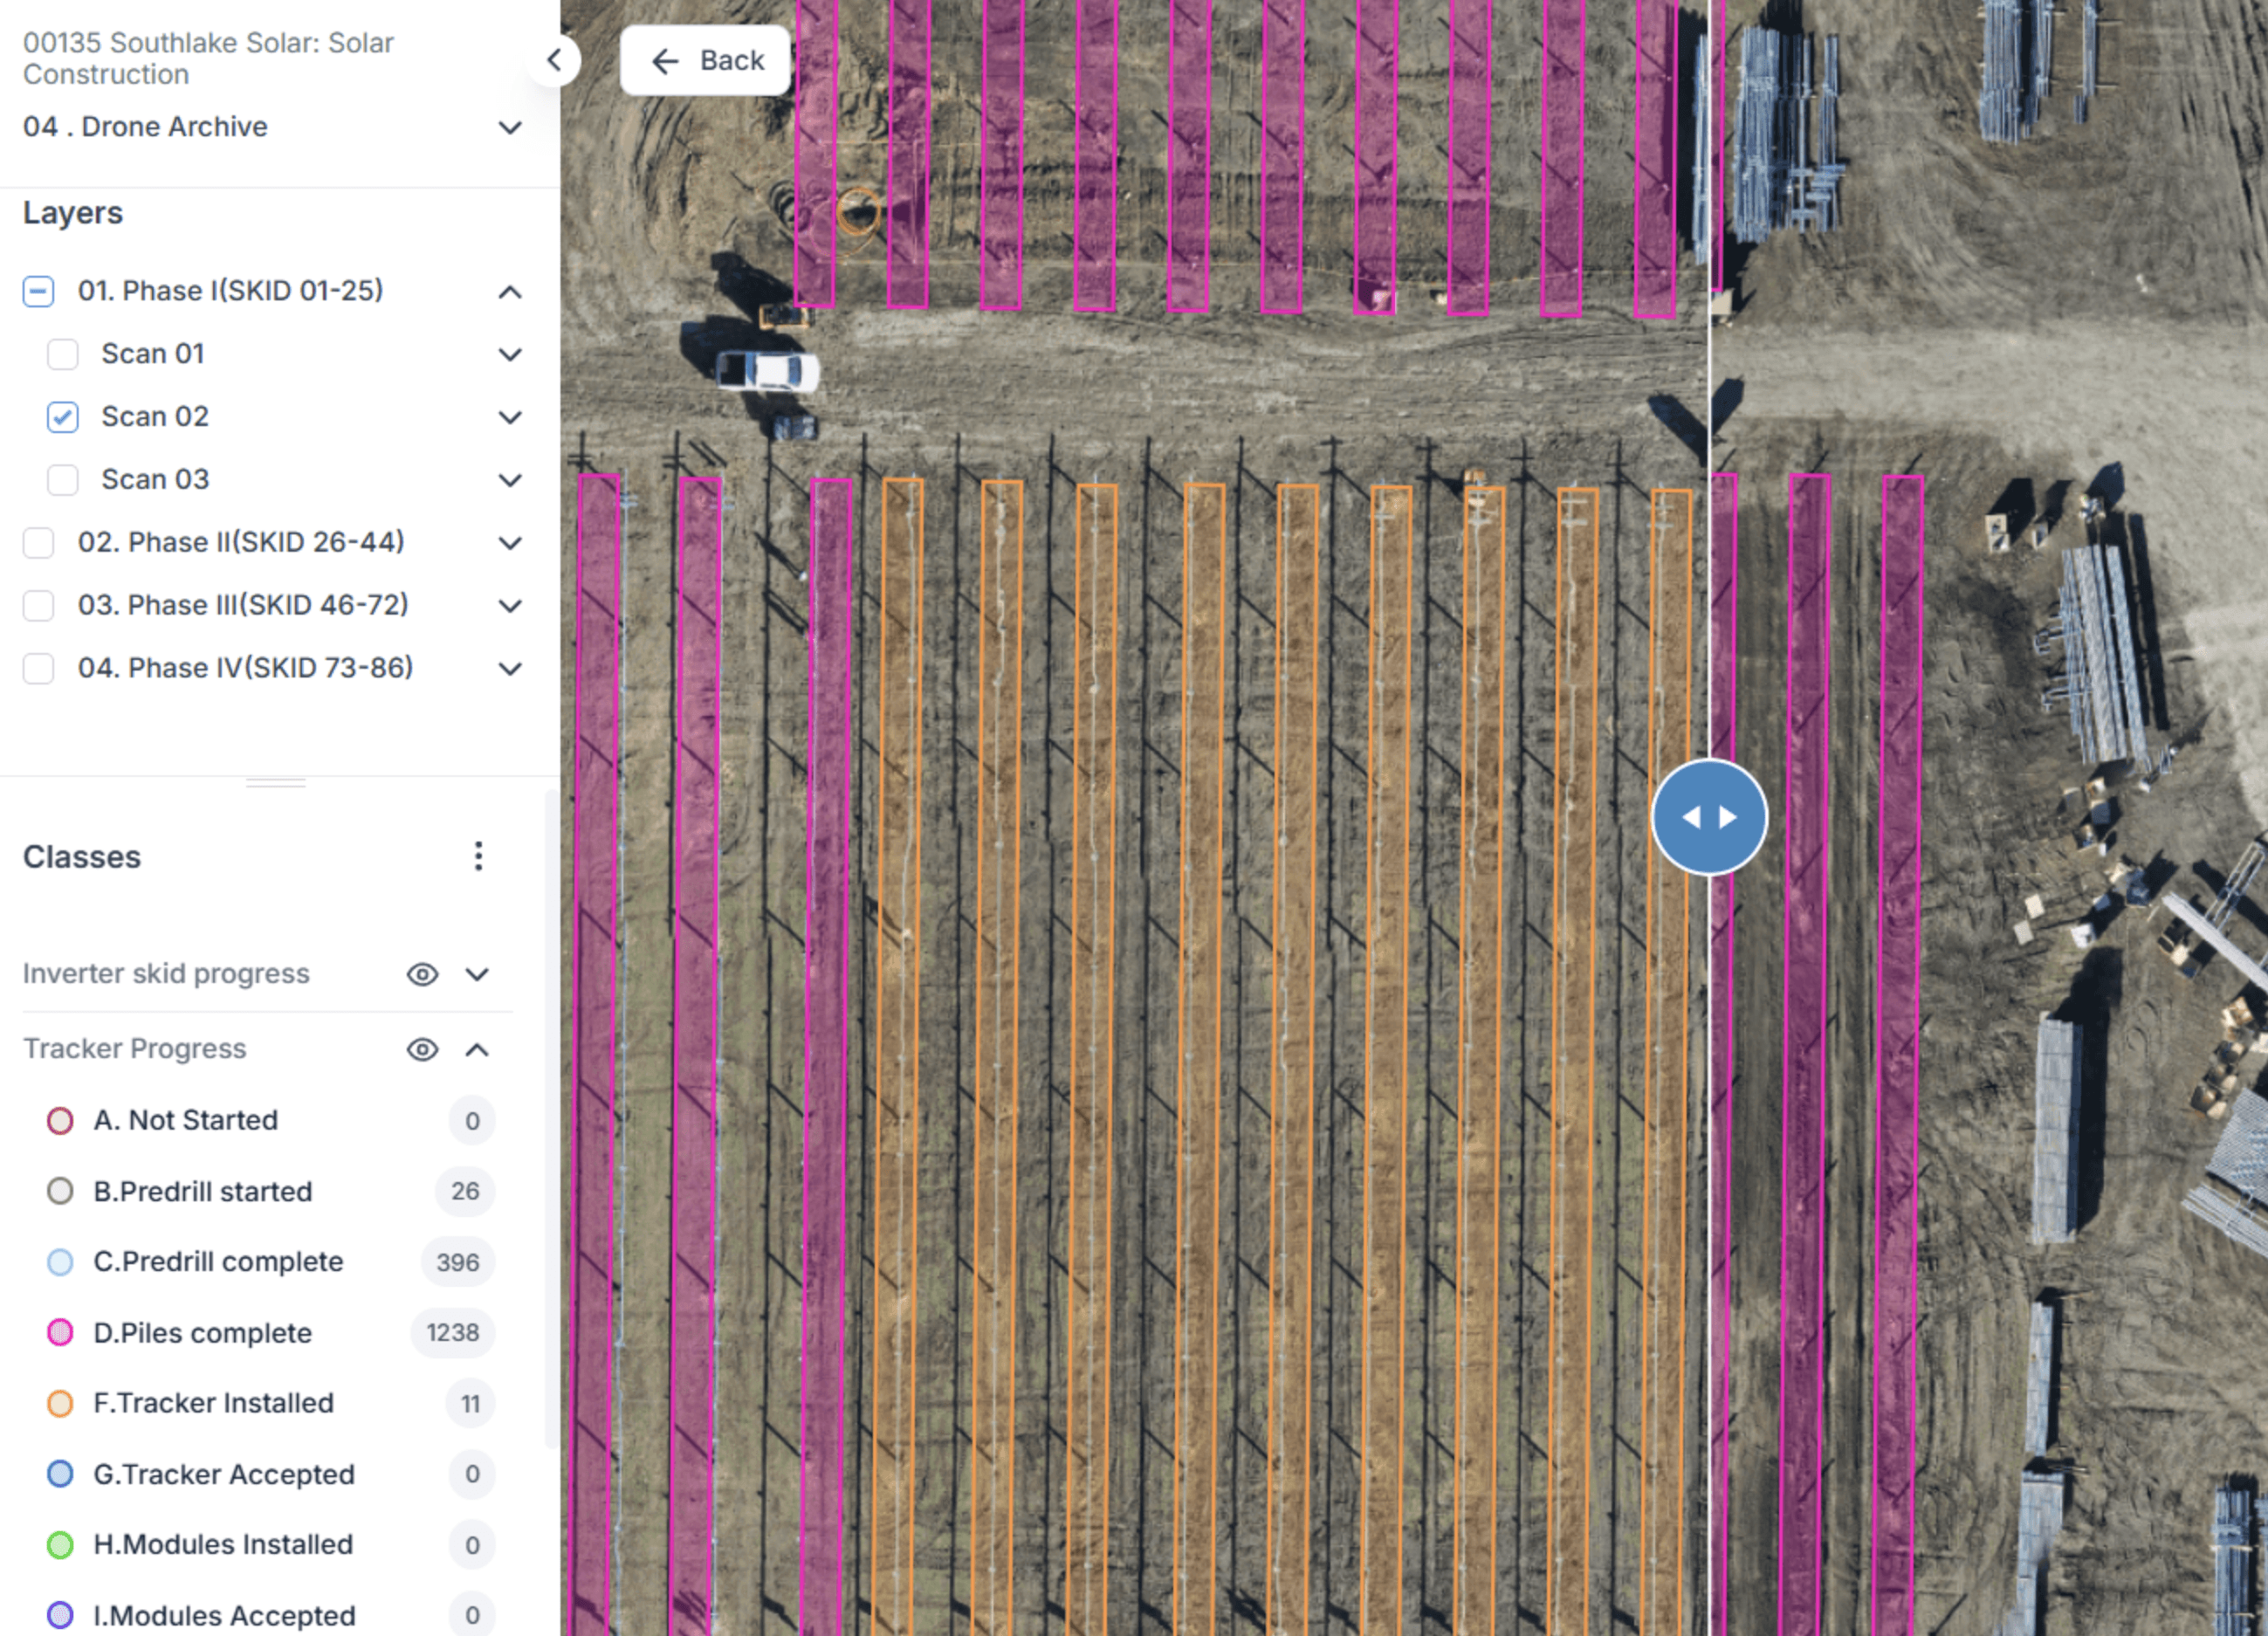
Your entire project site on an interactive map. Layer drone imagery, satellite photos, and CAD designs. Track progress block by block — visually.
From dashboards to decisions
Purpose-built products for construction intelligence, drone analytics, and AI-powered insights.
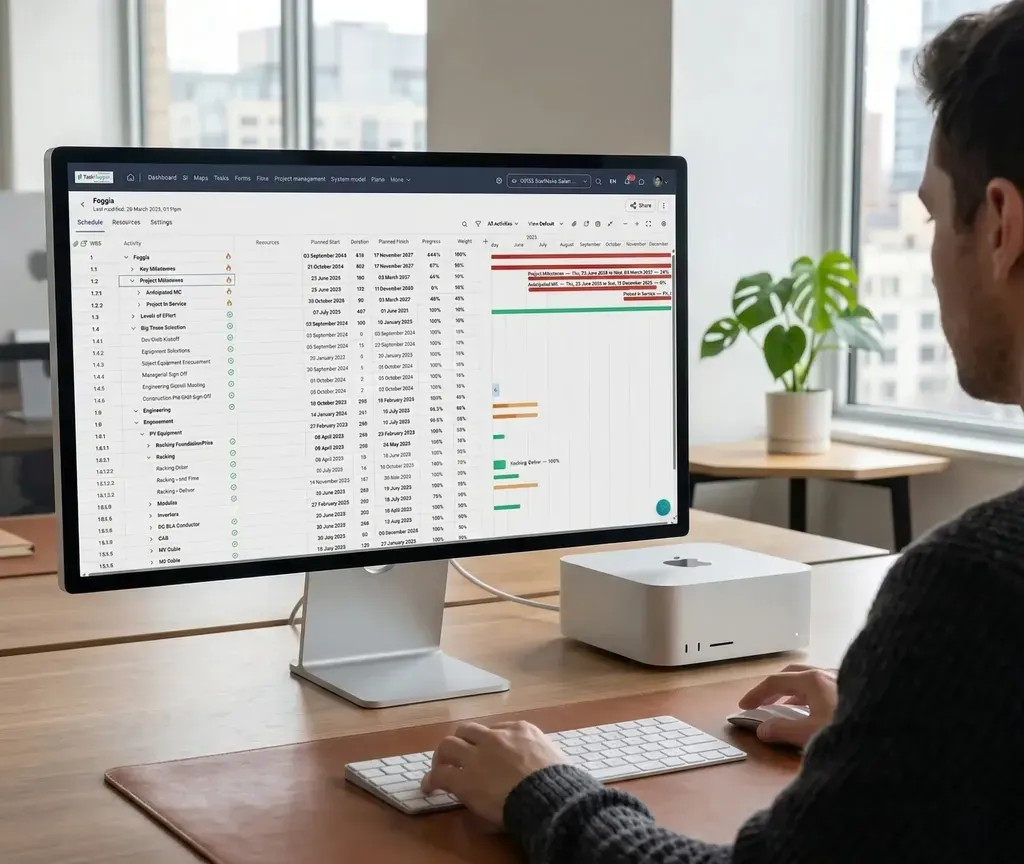
TaskMapper
Measuring the heartbeat of the site


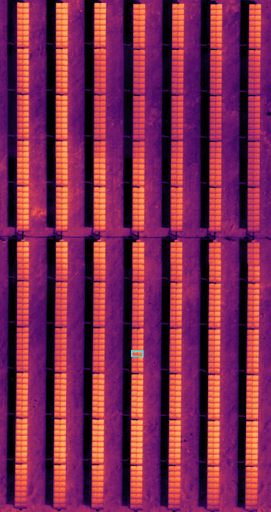
Therm
Enhance your solar asset inspections
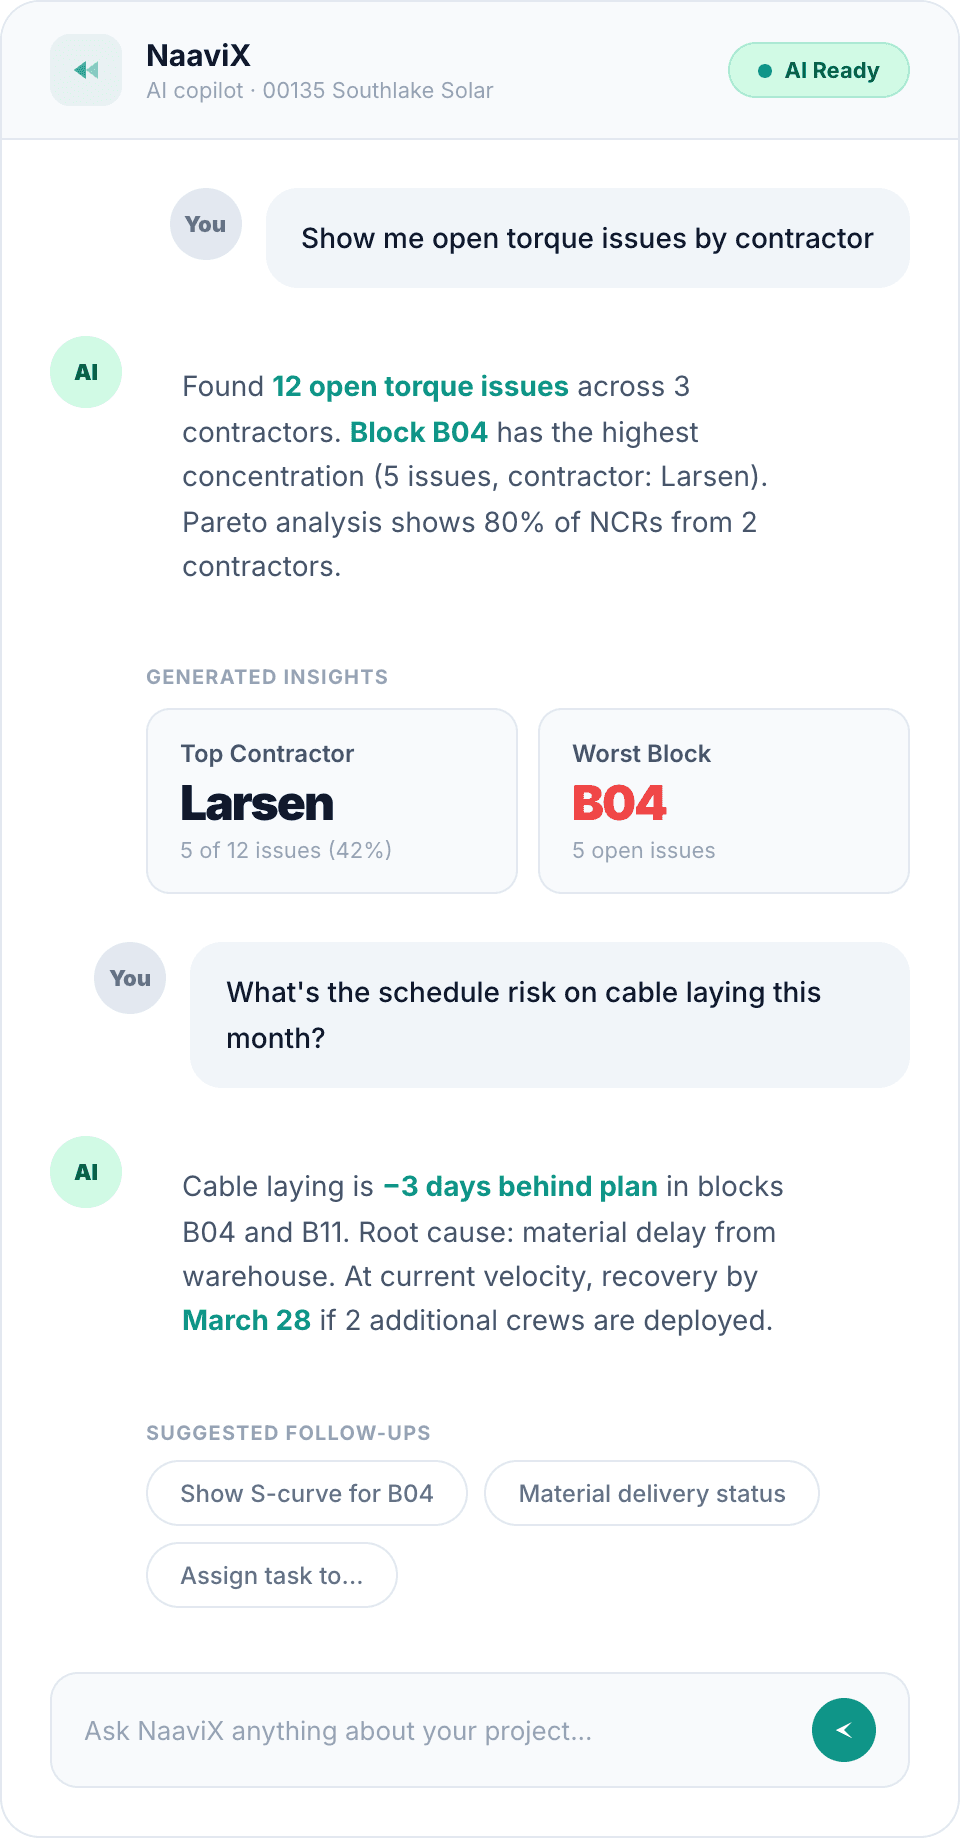
NaaviX AI
NaaviX — AI copilot for solar data
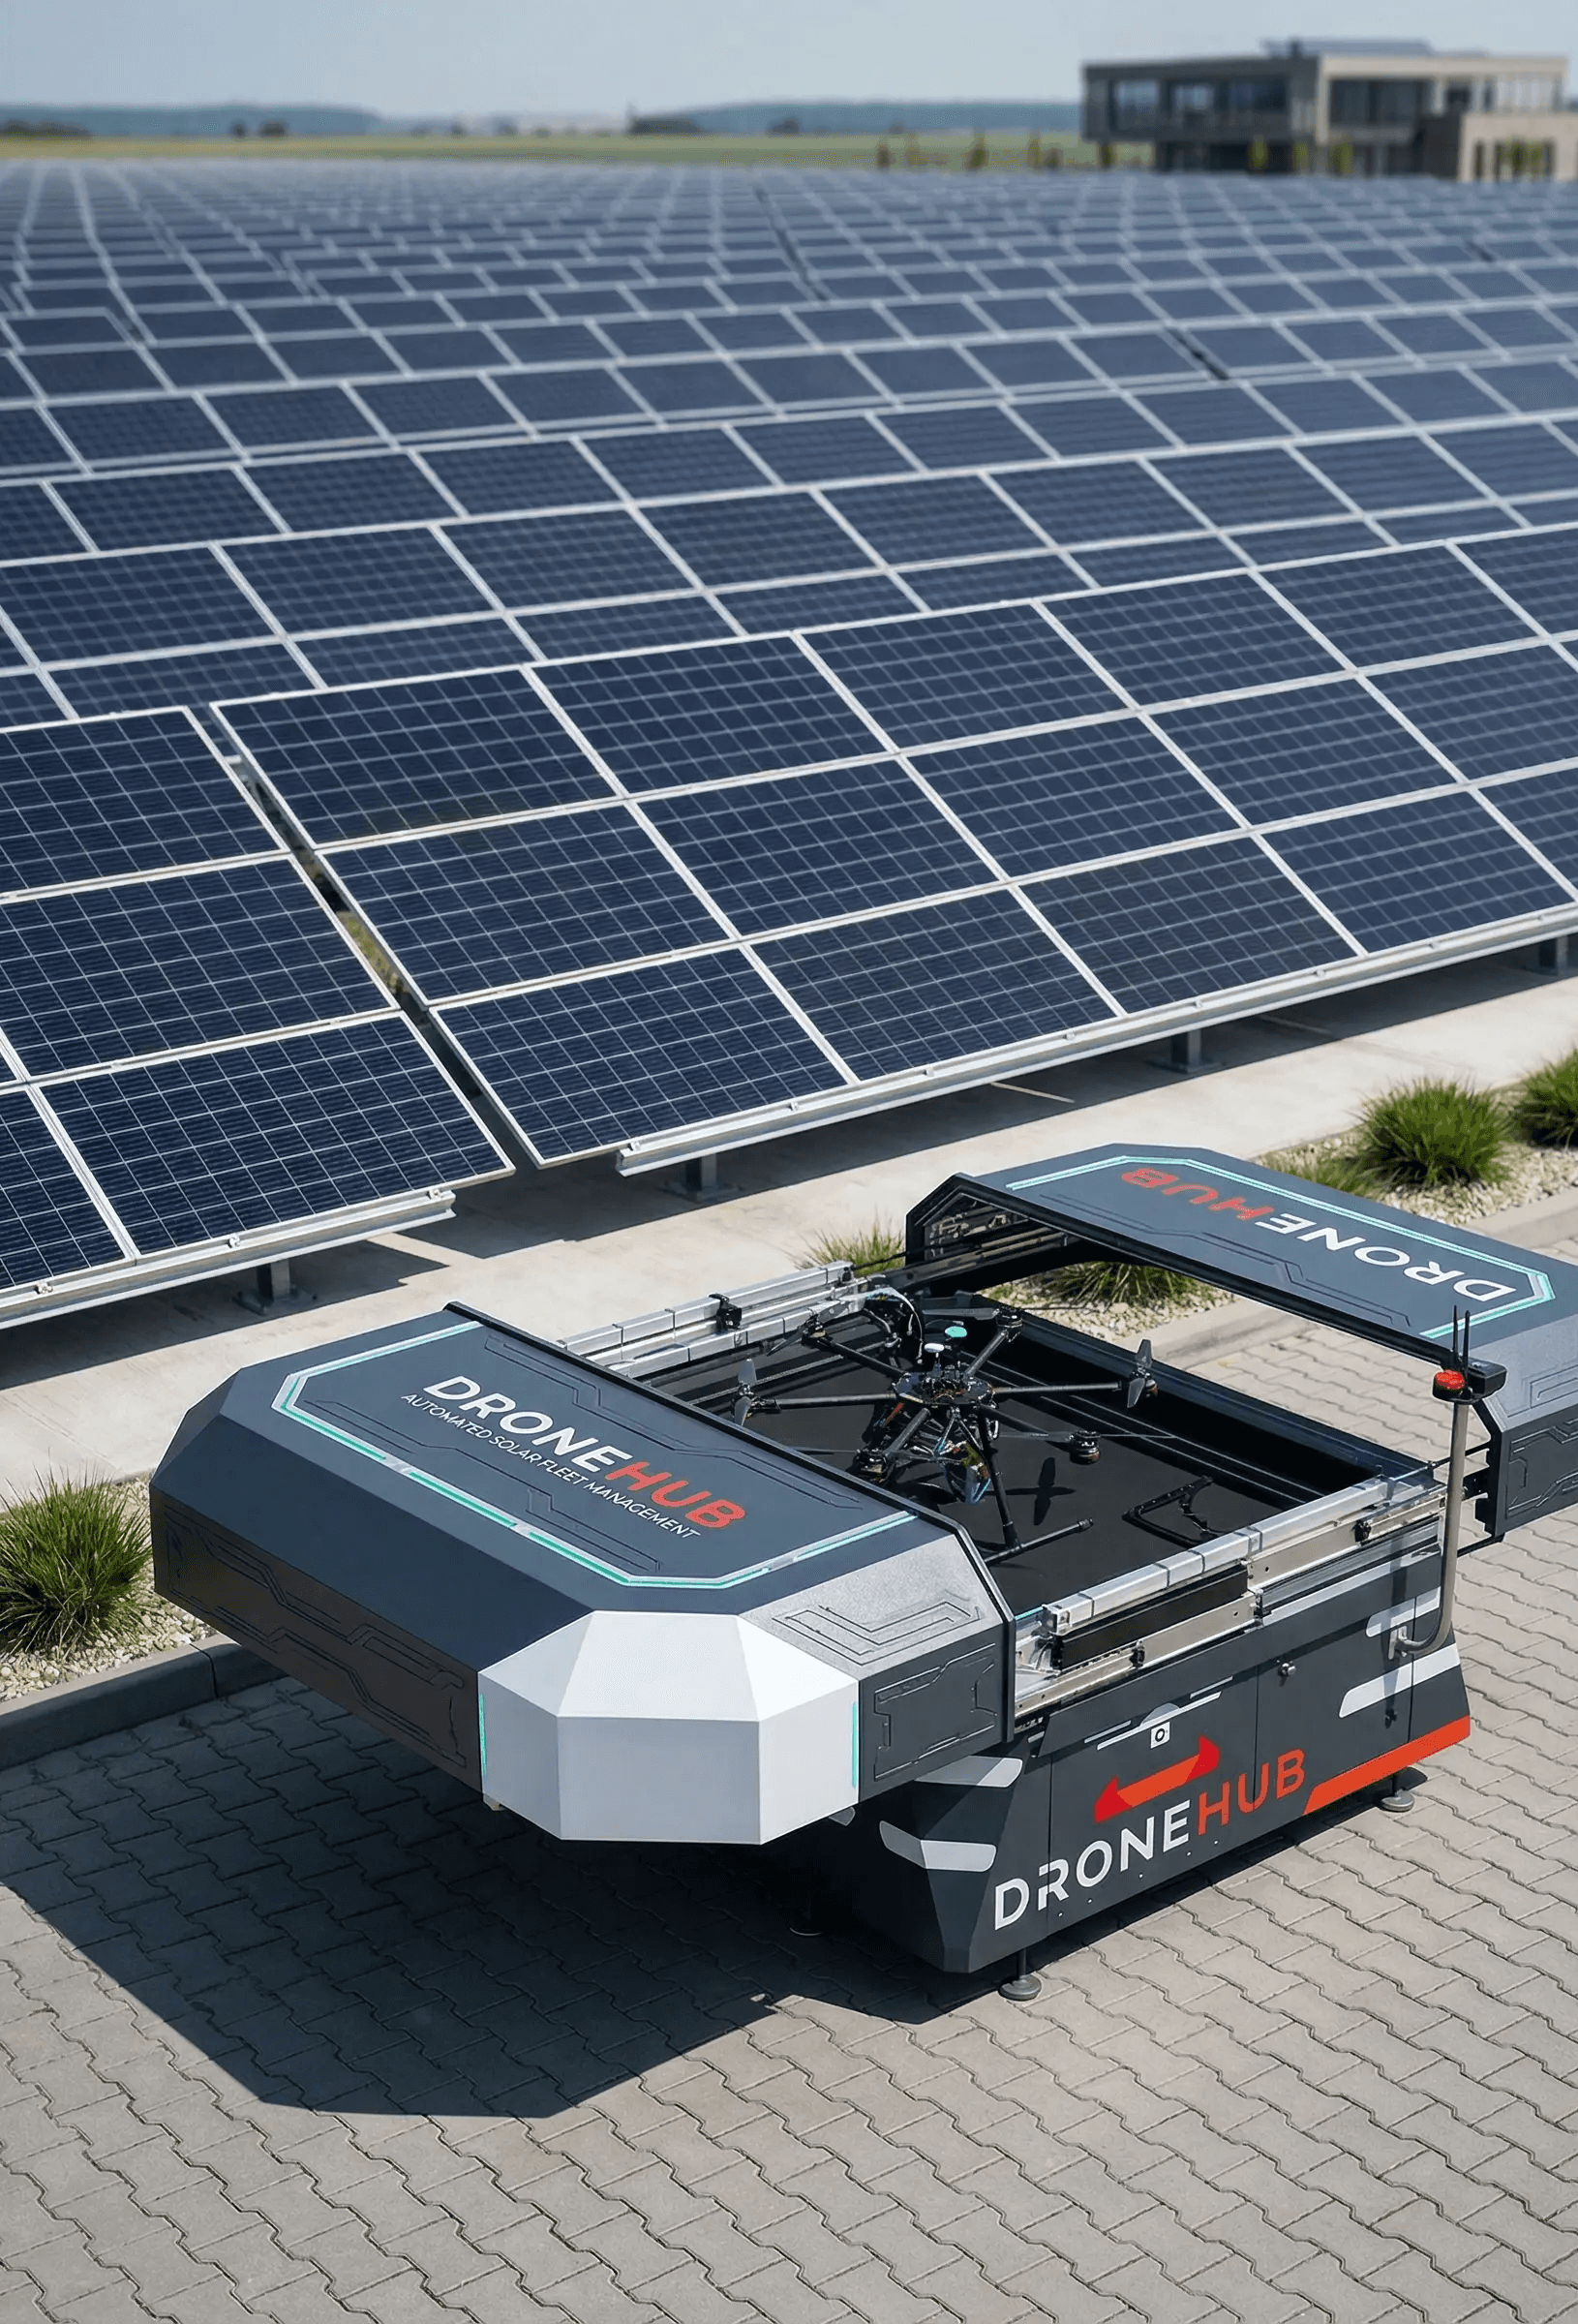

Drone Analytics
Replace manual site surveys with rapid drone analytics
Sustainability in Numbers
Delivering tangible ROI
Our solution is delivering significant value to solar EPCs and developers globally.
Sites Digitized Across 20+ Countries

Breaking down the silos. The integration engine.


SenseHawk connects your existing tools¹ into one hub — delivering decisions and insights, not just data.
Enterprise security
Enterprise-grade architecture
Built for GW-scale data and strict sovereignty requirements. 10,000+ concurrent users.


Blog & News from the SenseHawk team

Top 10 Features of Solar Project Management Software
Discover the 10 must-have features of solar project management software - from digital twins to AI analytics - and how SenseHawk delivers them at GW scale.

Solar Construction Management: Utility-Scale Guide (2026)
Complete guide to solar construction management for utility-scale projects: phases, QA/QC workflows, progress tracking, commissioning, and digital tools.

From As-Designed to As-Built: Validating Pre-Construction Layouts Against Real-World Performance
Every utility-scale solar asset looks perfect on a screen, but when Day 1 of commercial operations arrives, actual performance metrics rarely match pristine desktop simulations. A mathematical model simply cannot account for the real-world chaos that happens between design intent and the actual dirt—leaving teams to hunt for root-cause efficiency losses across a multi-thousand-acre guessing game. Here is how leading asset management teams are finally bridging the gap between design assumptions and field realities to protect their ROI.

Surviving Hybrid Commissioning: Fusing AC/DC-Coupled BESS Layouts into a Living Digital Twin
Transitioning a complex hybrid solar-plus-storage asset from design to active revenue is a high-stakes race against your Commercial Operation Date (COD). Fusing AC/DC-coupled BESS layouts into a living digital twin is the ultimate strategy to survive hybrid commissioning and bridge the gap between design theory and real-world field execution.

A Solar Farm Is Not a High-Rise. Why Generic Construction Software Is Killing Your Field Productivity
When you force a three square mile solar asset into software designed for a ten story office building, field productivity plummets. Discover why generic construction tools turn your best engineering talent into manual data janitors, and learn how a dedicated geospatial engine gives leadership real time project control.

SCADA Says "Fault." Your Spreadsheet Says "Wait." Closing the Loop between Solar Alarms and Autonomous Drones.
If you manage utility-scale solar assets, you know that finding a performance drop is easy. The real headache is the administrative lag and manual guesswork required to actually fix it. Traditional operations often separate your performance data from physical reality, leading to delayed responses and lost revenue. It’s time to bridge that gap.


Frequently Asked Questions
Can SenseHawk handle GW-scale portfolios?
Does the platform support hybrid Solar + BESS sites?
Does SenseHawk support turbine blade inspections?
Is the data secure for sensitive infrastructure?
Does the platform work offline?