
TaskMapper : GIS-powered site planning and as-built monitoring
Map-based terrain analysis and construction monitoring improves planning, collaboration, and tracking for successful execution of solar projects.

Team SenseHawk
Published on

Map-based terrain analysis and construction monitoring improves planning, collaboration, and tracking for successful execution of solar projects.
Team SenseHawk
Published on
Map-based terrain analysis and construction monitoring solutions can significantly enhance planning and process efficiency during the development stage of solar energy projects.
The assessment of topography and hydrology is pivotal in site selection and design. Viewing project design on a detailed terrain map of the site helps planners visualize and examine the terrain's elevation, slope, and water features and identify optimal locations for solar installations to ensure efficient energy capture and minimal environmental impact. Understanding hydrological patterns enables proper water management, reducing the risk of erosion and flooding.
Construction monitoring with map-based tools to track real-time progress and quality control provides visual data, facilitating accurate monitoring of construction activities, equipment placement, and adherence to design specifications. This, in turn, helps improve project management, reducing errors and delays while optimizing resource allocation.
TaskMapper is SenseHawk’s platform for end-to-end asset construction and operations monitoring and management. The Terra feature of the platform enables the creation of data-enriched interactive site maps for land studies with GIS data layers to visualize topography, horizontal irradiance, IFC design layout, construction progress, as-built, and more.
Map views of the job sites are created by uploading KML (keyhole markup language) and CAD (computer-aided design) files to the platform. Data is integrated as layers from multiple sources, including geospatial surveys and drone scans. SLDs (single-line diagrams) are built and digitized to create the digital twin of the asset, visualizing the components, their interlinkages, and hierarchies. The map interface is as easy to use as Google Maps and helps visualize the asset location, boundaries, structures, equipment, and materials, among other features.
TaskMapper provides a central repository for all asset information, centralizing and organizing historical and real-time data for easy access and sharing. This facilitates stakeholder collaboration and communication, enabling analytics for informed decision-making to streamline and optimize asset construction, commissioning, and operating cost control.
Users can digitize and centralize all available project data, documents, and records, including design options, BOM (bill of materials), contracts, and files, from the outset, enabling access to information and records at different stages of the asset lifecycle. Authorized access to asset-related documents, including warranties, claims, commissioning, and inspections, facilitates workflows to accelerate processes. Centralized data simplifies planning and permitting process management and development workflows.
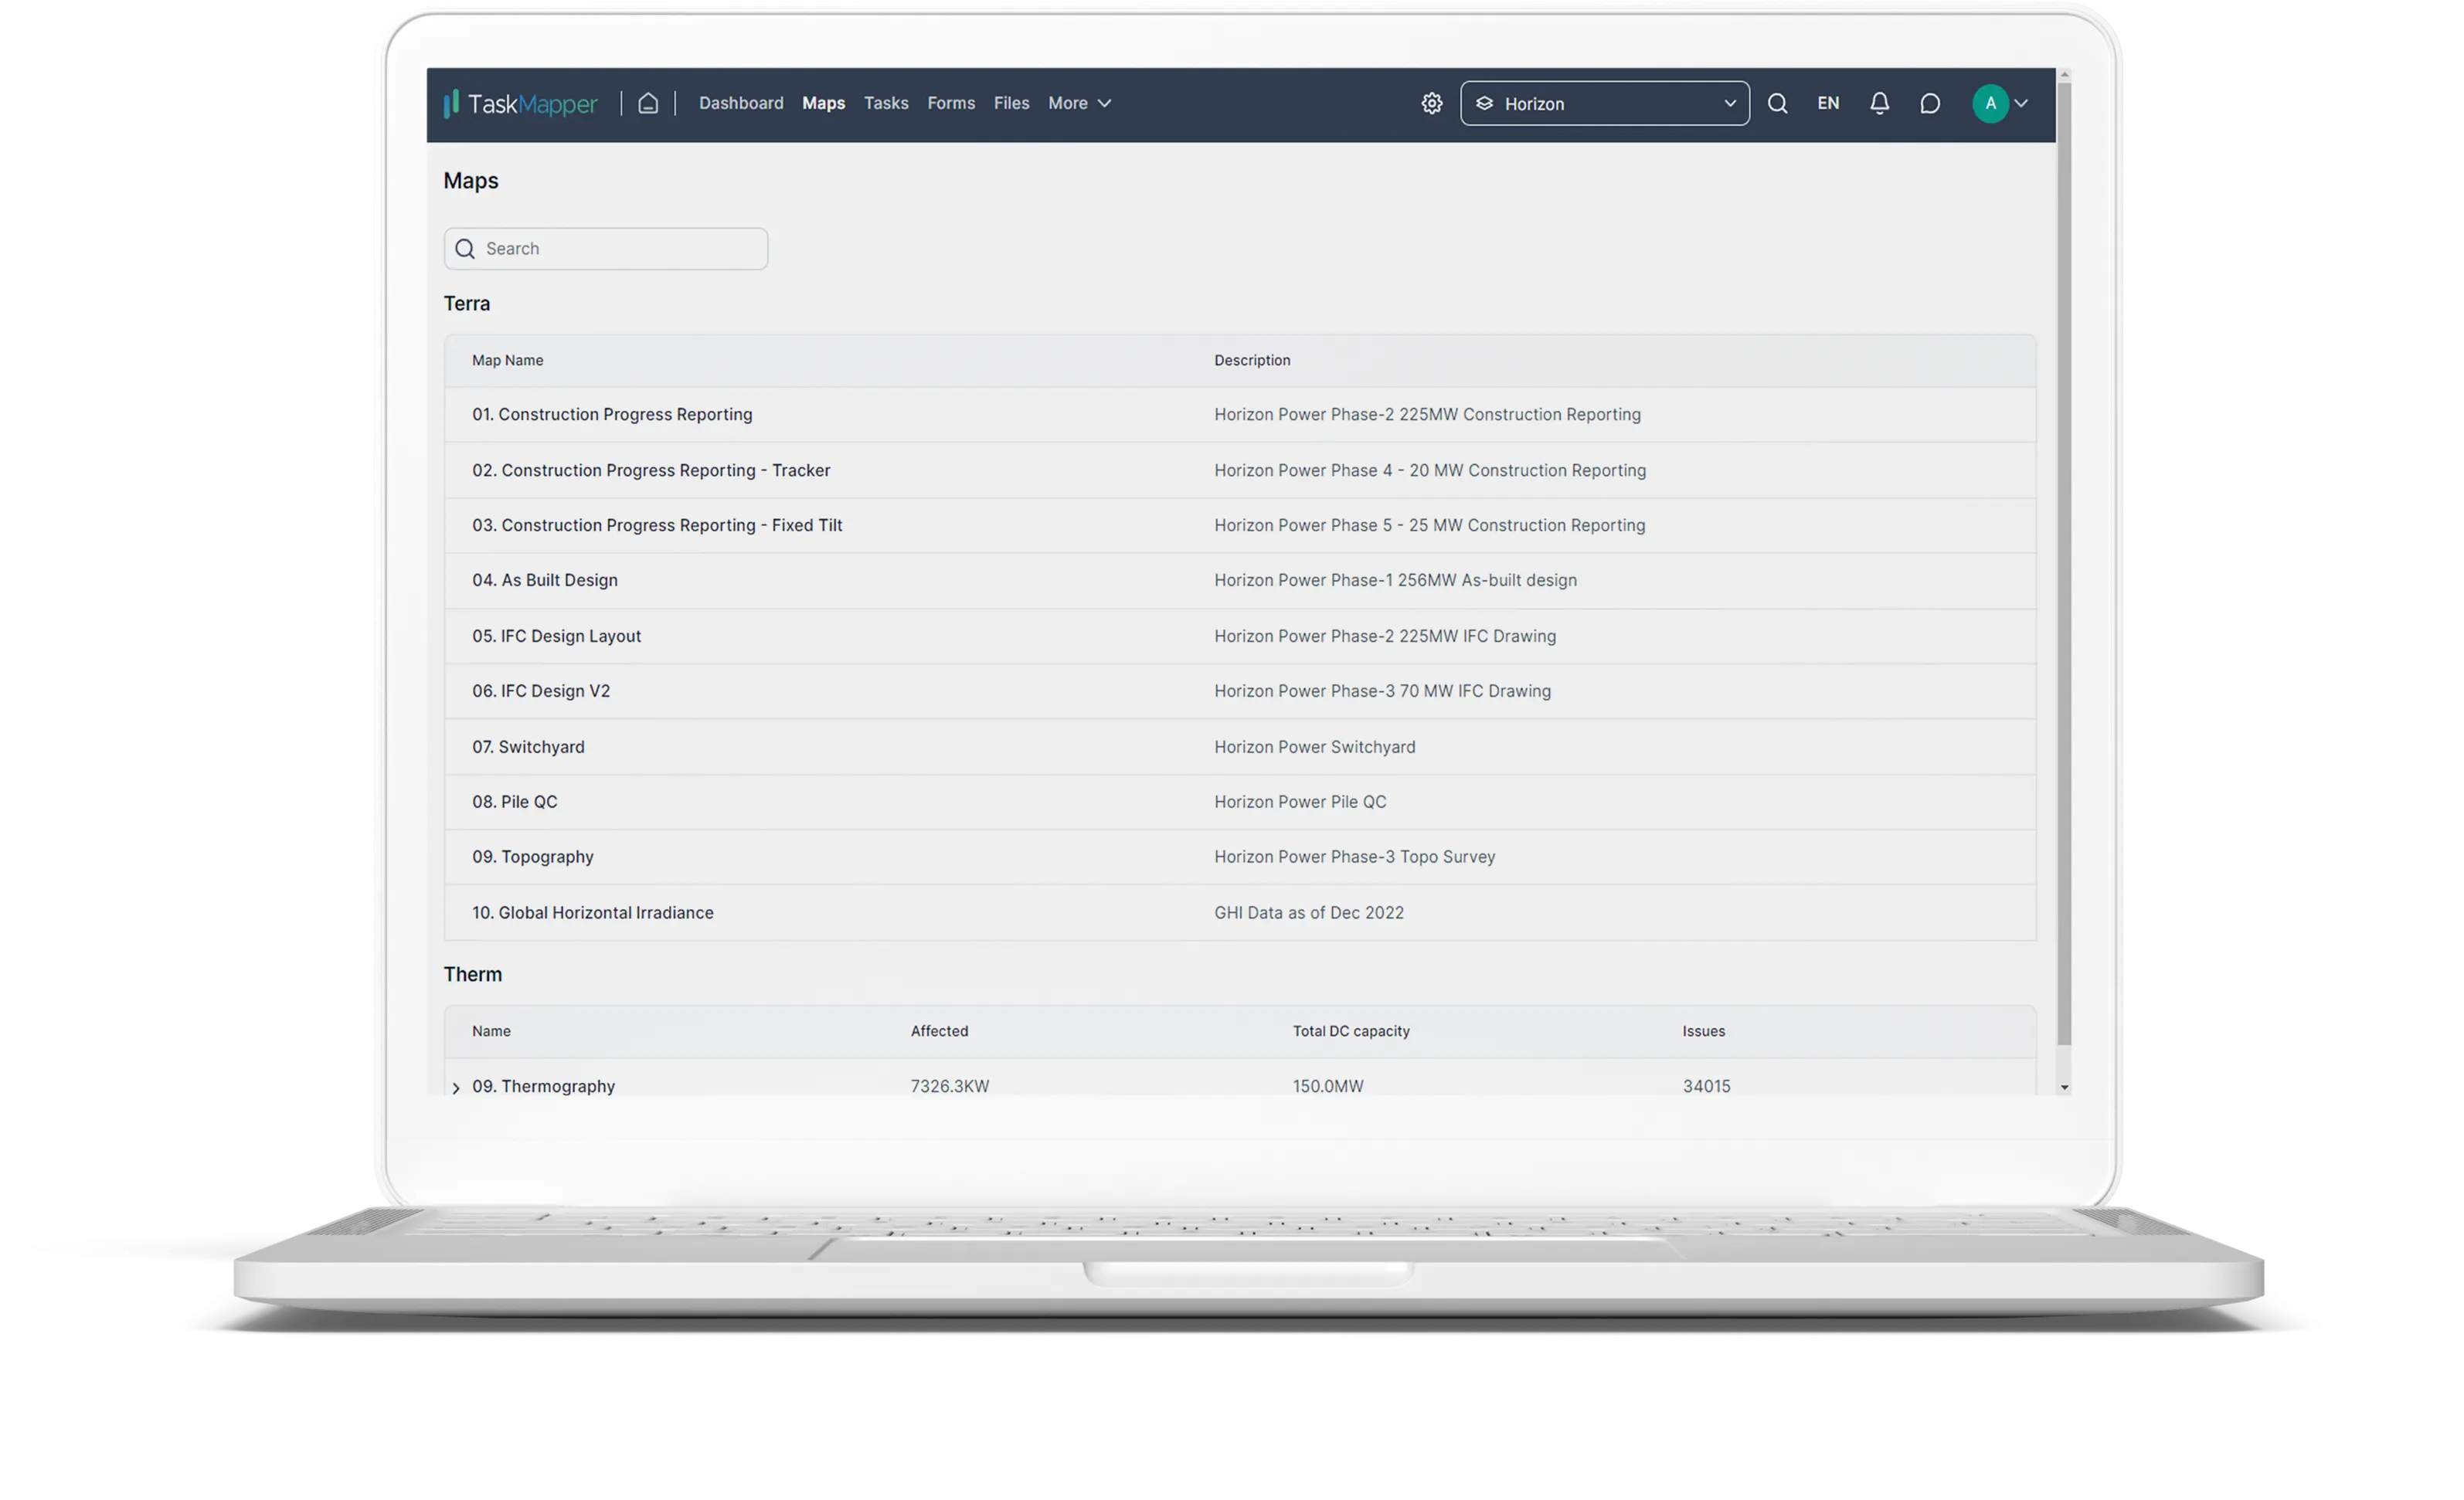
Create an interactive map of your site layered with design, CAD attributes, drone, and other data
TaskMapper allows you to create activities linked to equipment and locations on a site map. You can click on the digital twin of the component and add a task along with all relevant information, including sub-tasks, checklists, files, images, and dependencies. This map-based work management enhances collaboration and contextual communication and optimizes the use of resources and equipment for better planning. Geo-located tasks that are accessible on a mobile interface also reduce orientation time for new site technicians.

Create and assign a new task or form, or upload a file directly on the site map
With Terra, you can visualize work progress based on real-time inputs from the field. The overlay of geo-located tasks allows onsite crews to directly navigate to the issue and create an update with supporting media files. The field updates reflect as color-coded vector layers on the digital site map. The associated legend also summarizes installation numbers for the related component to simplify installation progress tracking.
Users can configure dashboards to track work progress and other site activity reports and integrate POD (plan of day), charts, map visualizations, status, and more. Shared views for contractors, suppliers, and regulatory authorities help streamline multi-stakeholder communication. Users can also import project schedules and connect the CAD-on-a-map to the schedule and inventory for better work management.
The integration of periodic drone scan data further enriches map-based jobsite tracking and reporting. It can accelerate construction monitoring, enable early tracking of installation issues, and map, classify, and prioritize thermal defects. The geo-tagged defects can then be easily converted into tasks and assigned for action. TaskMapper also enables the integration of alarms from ROC, SCADA, and performance management systems to generate tasks on a map.

Simplify construction management with map-based progress tracking and reporting
Geo-locating activities simplify work management as well as reporting. Field crew can access tasks on the map-powered mobile app and report onsite progress in real-time. The app functions even in offline mode and syncs when reconnected, ensuring data integrity. TaskMapper users can create construction workflows on the map interface to automate reporting up to L5/L6 schedule activities.
With the map interface of TaskMapper, users can click on the CAD element of any component on the map and pull up its entire history. Users can view previous actions and data, including design revisions, datasheets, progress updates, checklists, reports, files, defects, punch items, and more.
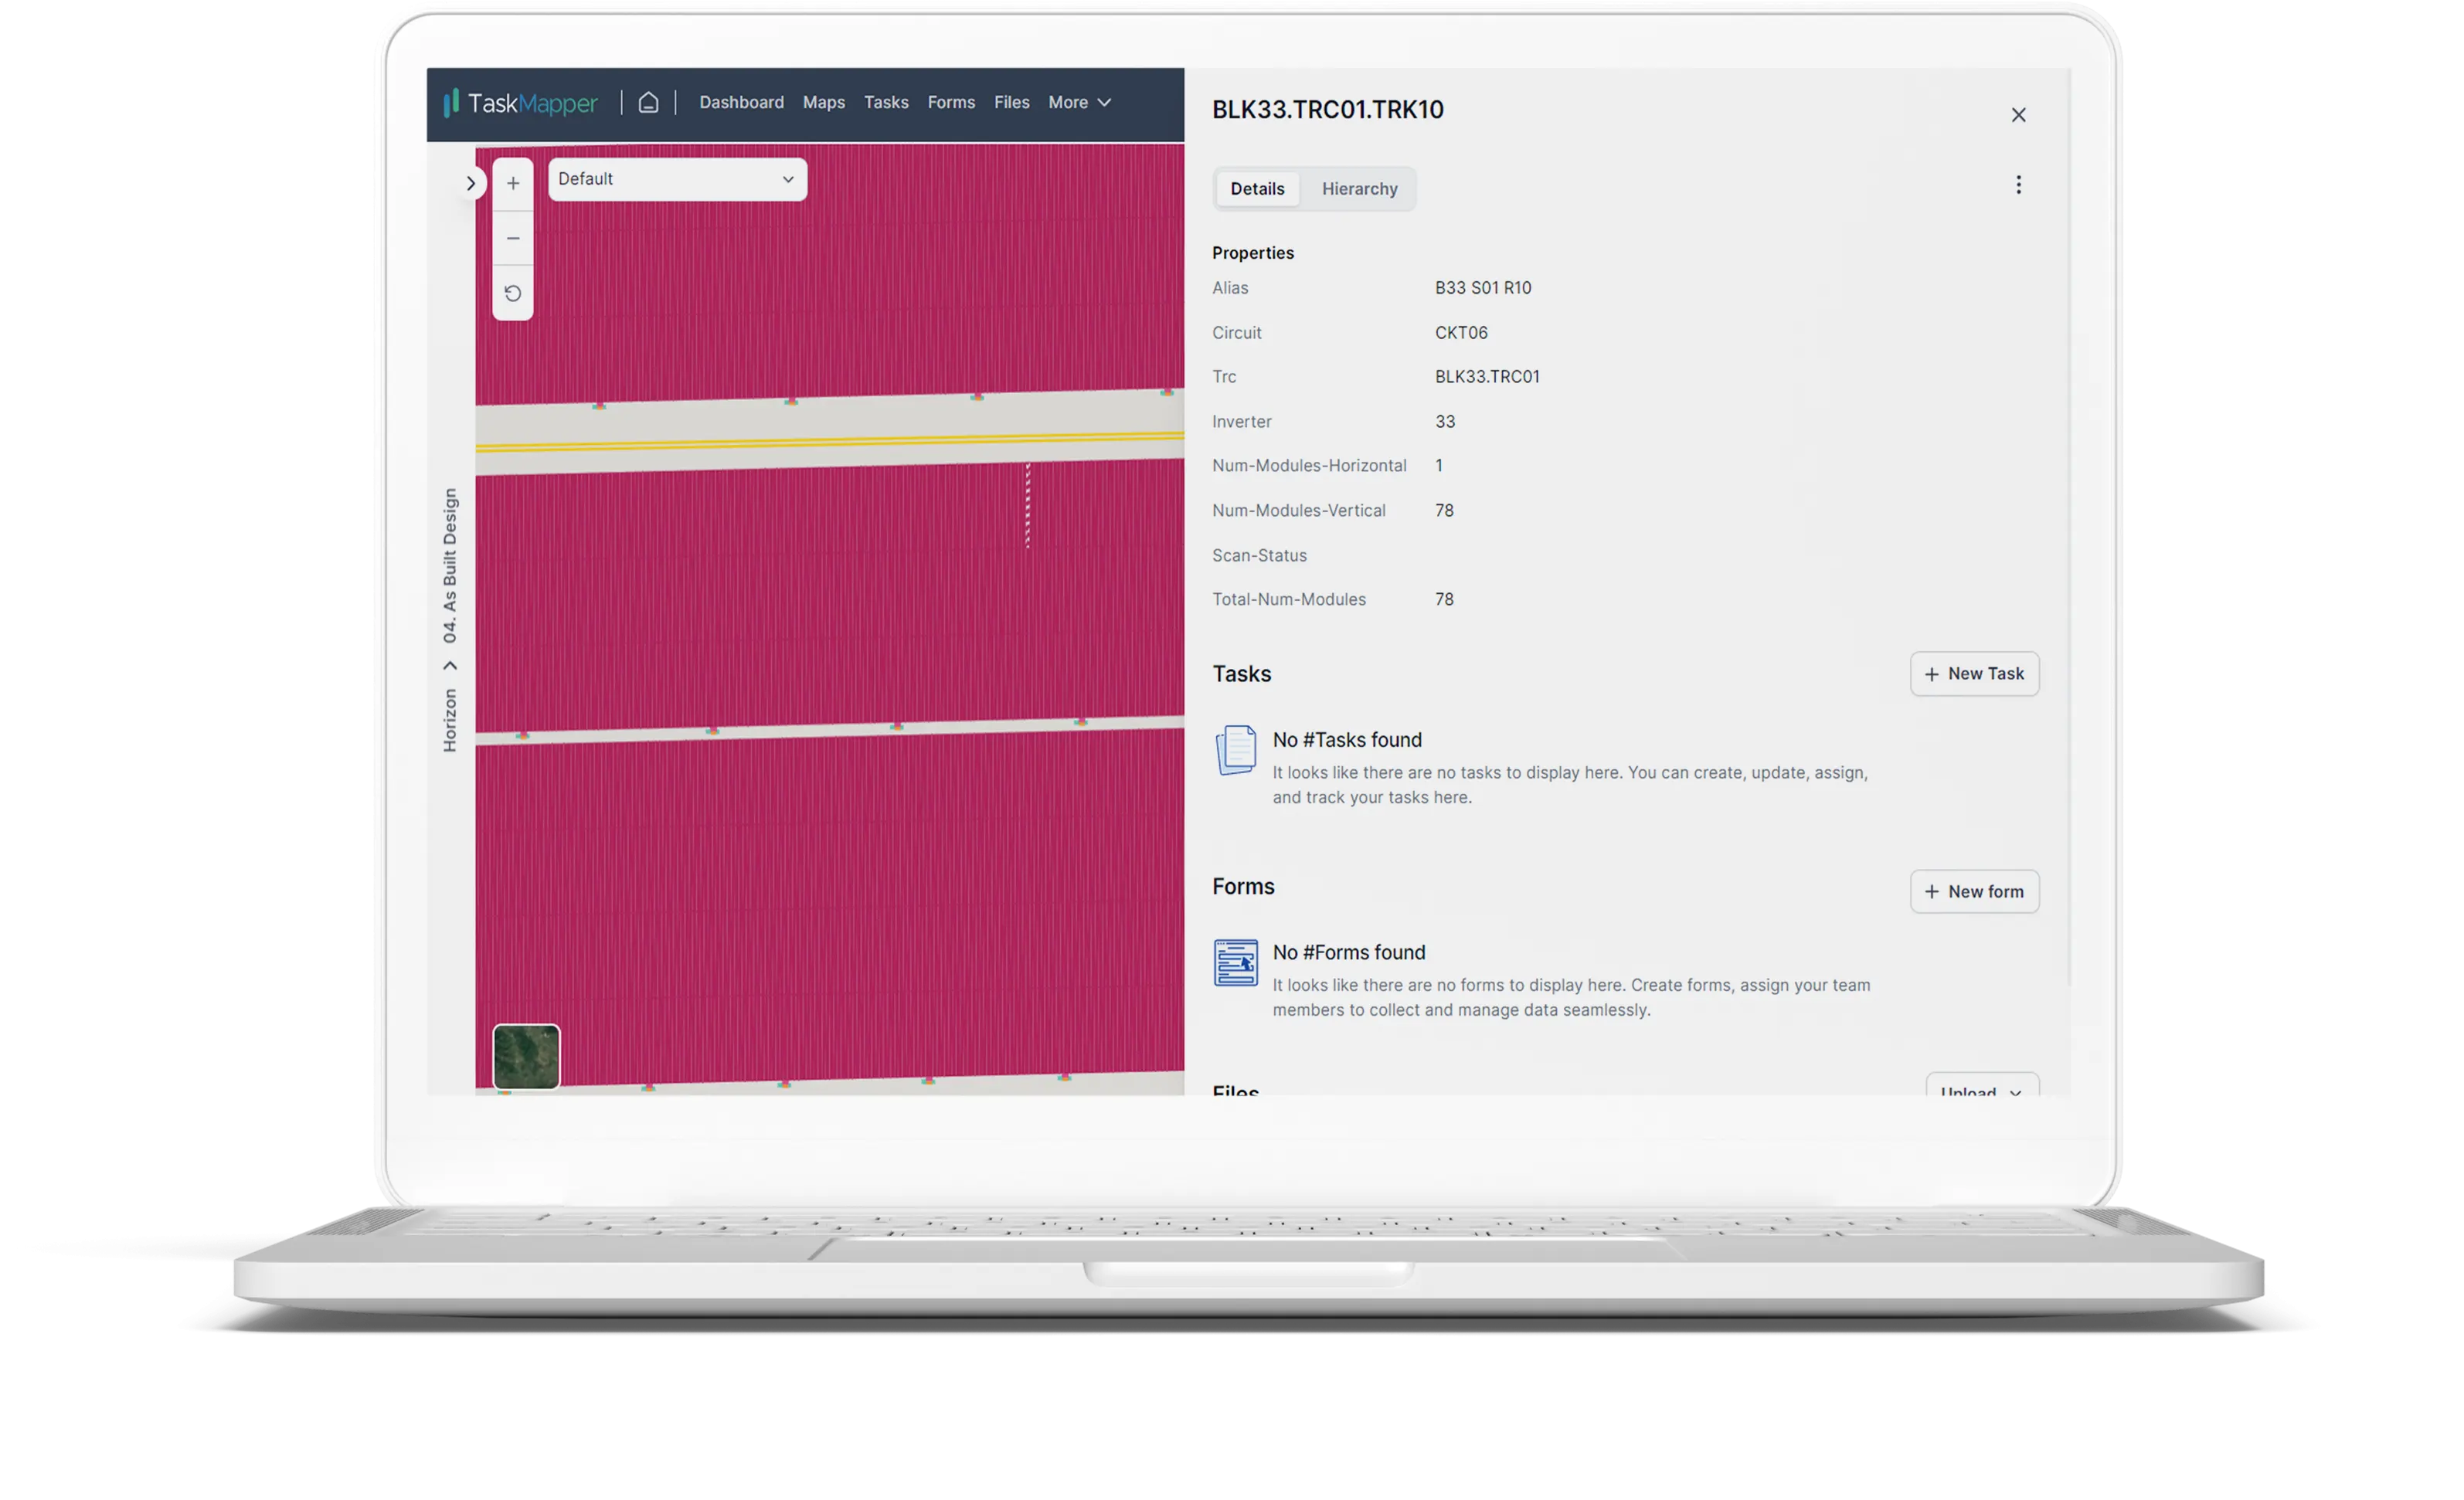
Click on the digital twin of any component to access associated details, including warranty information, maintenance history, linkages with other components, and related tasks and forms
To know more about the advantages of a GIS-powered unified platform for asset monitoring and management, visit Maps.
Map-based terrain analysis and construction monitoring solutions can significantly enhance planning and process efficiency during the development stage of solar energy projects.
Karthik Mekala
CMO