

Browse other blogs
The 50-Meter Blind Spot: What Your Wind Turbine Inspections Are Missing
If you manage wind assets, you know the anxiety.
You have a 47.5-meter blade spinning at up to 16 RPM. You know it's taking a beating from the elements, but how do you really know what micro-fractures, erosion, or lightning damage are developing 90 meters in the air?
Traditionally, we relied on manual rope-access inspections—which are slow, expensive, and dangerous. Then came basic drone photography. It was safer, but it created a new problem: The Data Dump. Handing an O&M manager a shared drive with 500 unlabelled JPEGs of a turbine isn't an inspection. It's a homework assignment. Without geospatial context and severity mapping, it’s just noise.
This is the 50-meter blind spot. And here is how we fix it.
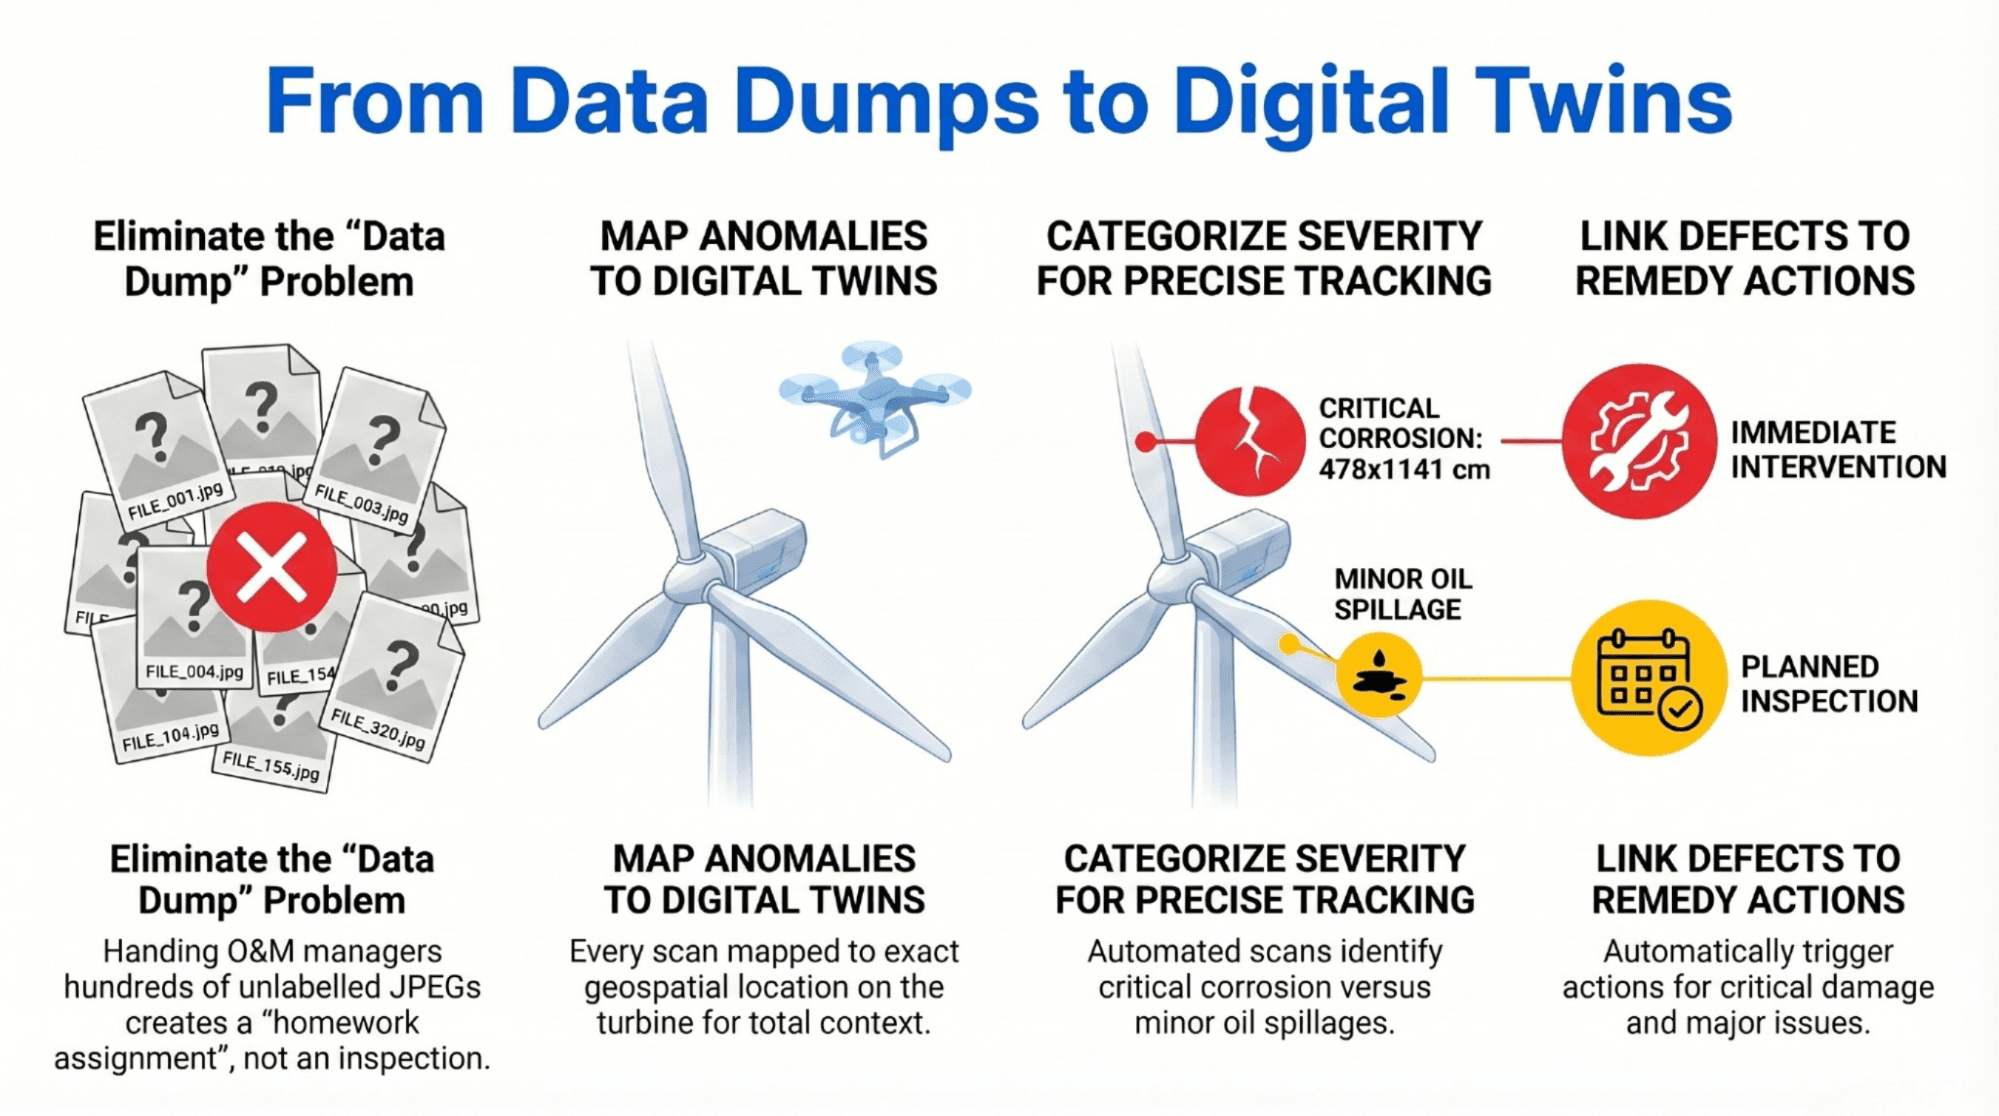
Stop Hoarding JPEGs. Start Building a Digital Twin.
Drone data is only as good as the system it lives in. At SenseHawk, we process drone scans by mapping every anomaly directly to the exact location on the wind turbine's Digital Twin.
Let’s look at a real-world example from a recent scan of a 2.0 MW Gamesa turbine at a site in India.
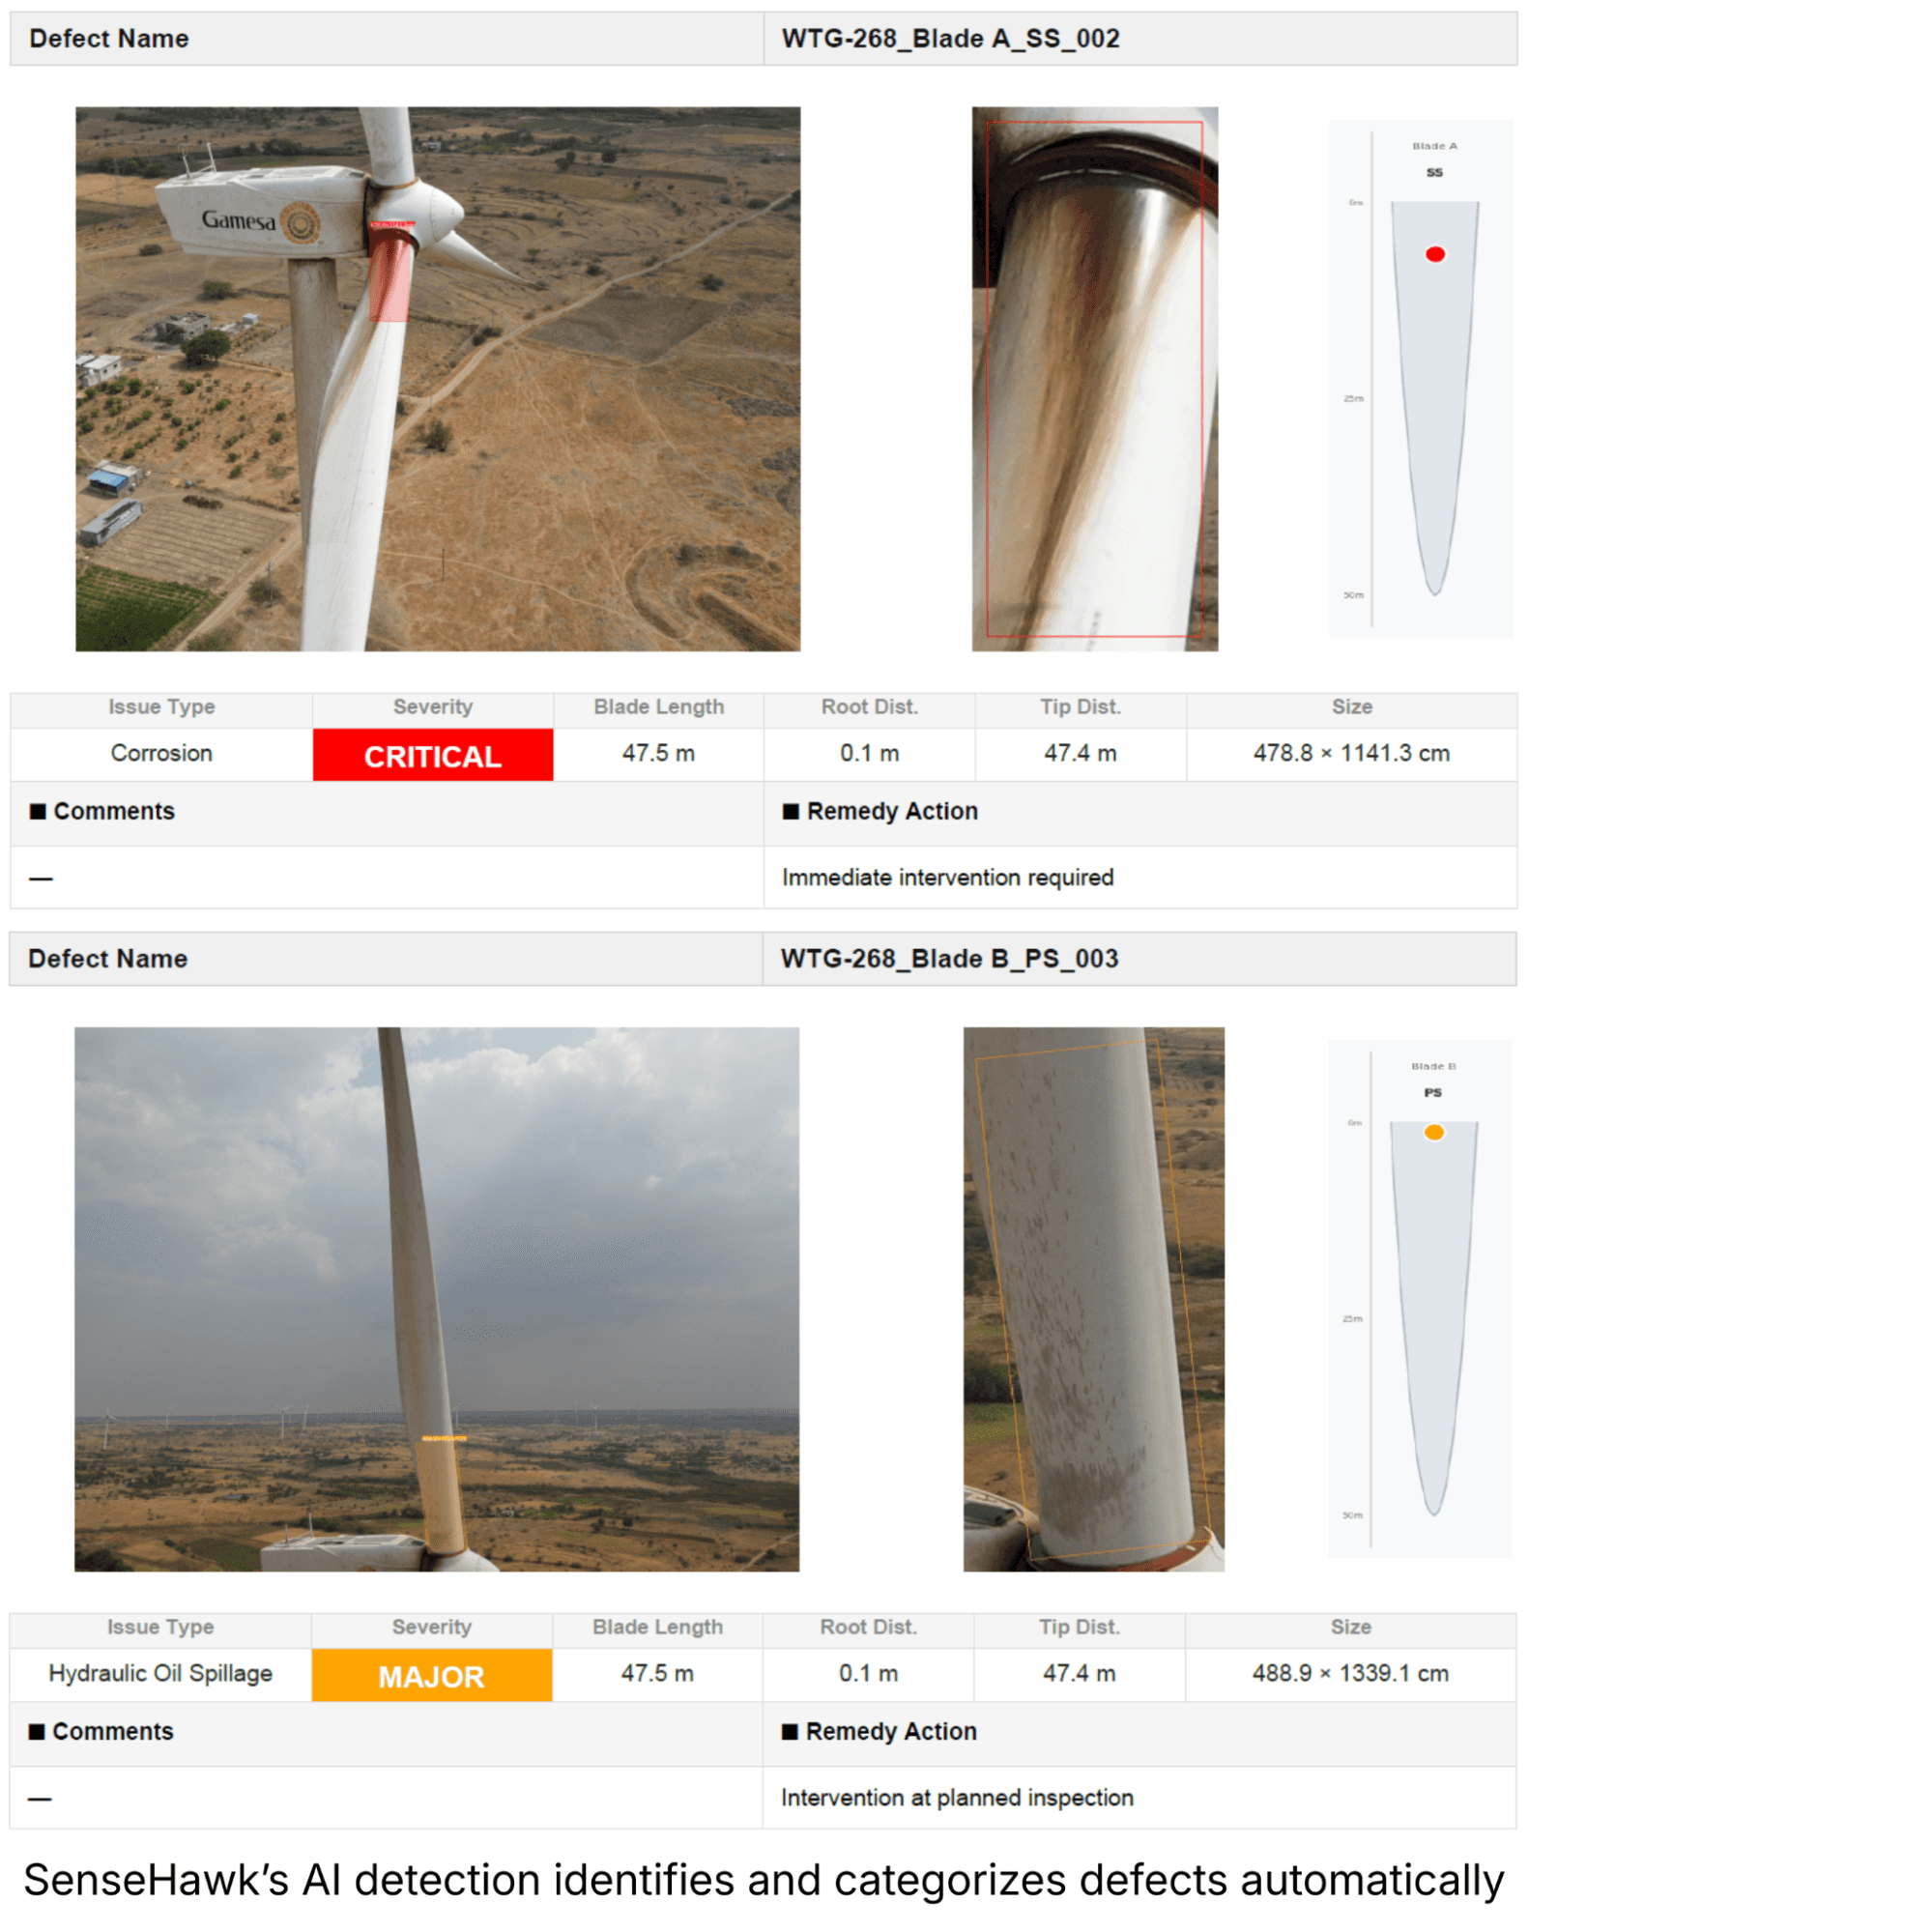
Because the data was structured and mapped, the O&M team didn't just get a blurry photo of a blade. They received a precise, actionable breakdown:
Blade A (Suction Side): The scan detected a CRITICAL area of corrosion measuring 478.8 X 1141.3cm.
Blade B (Pressure Side): The system flagged a MAJOR hydraulic oil spillage.
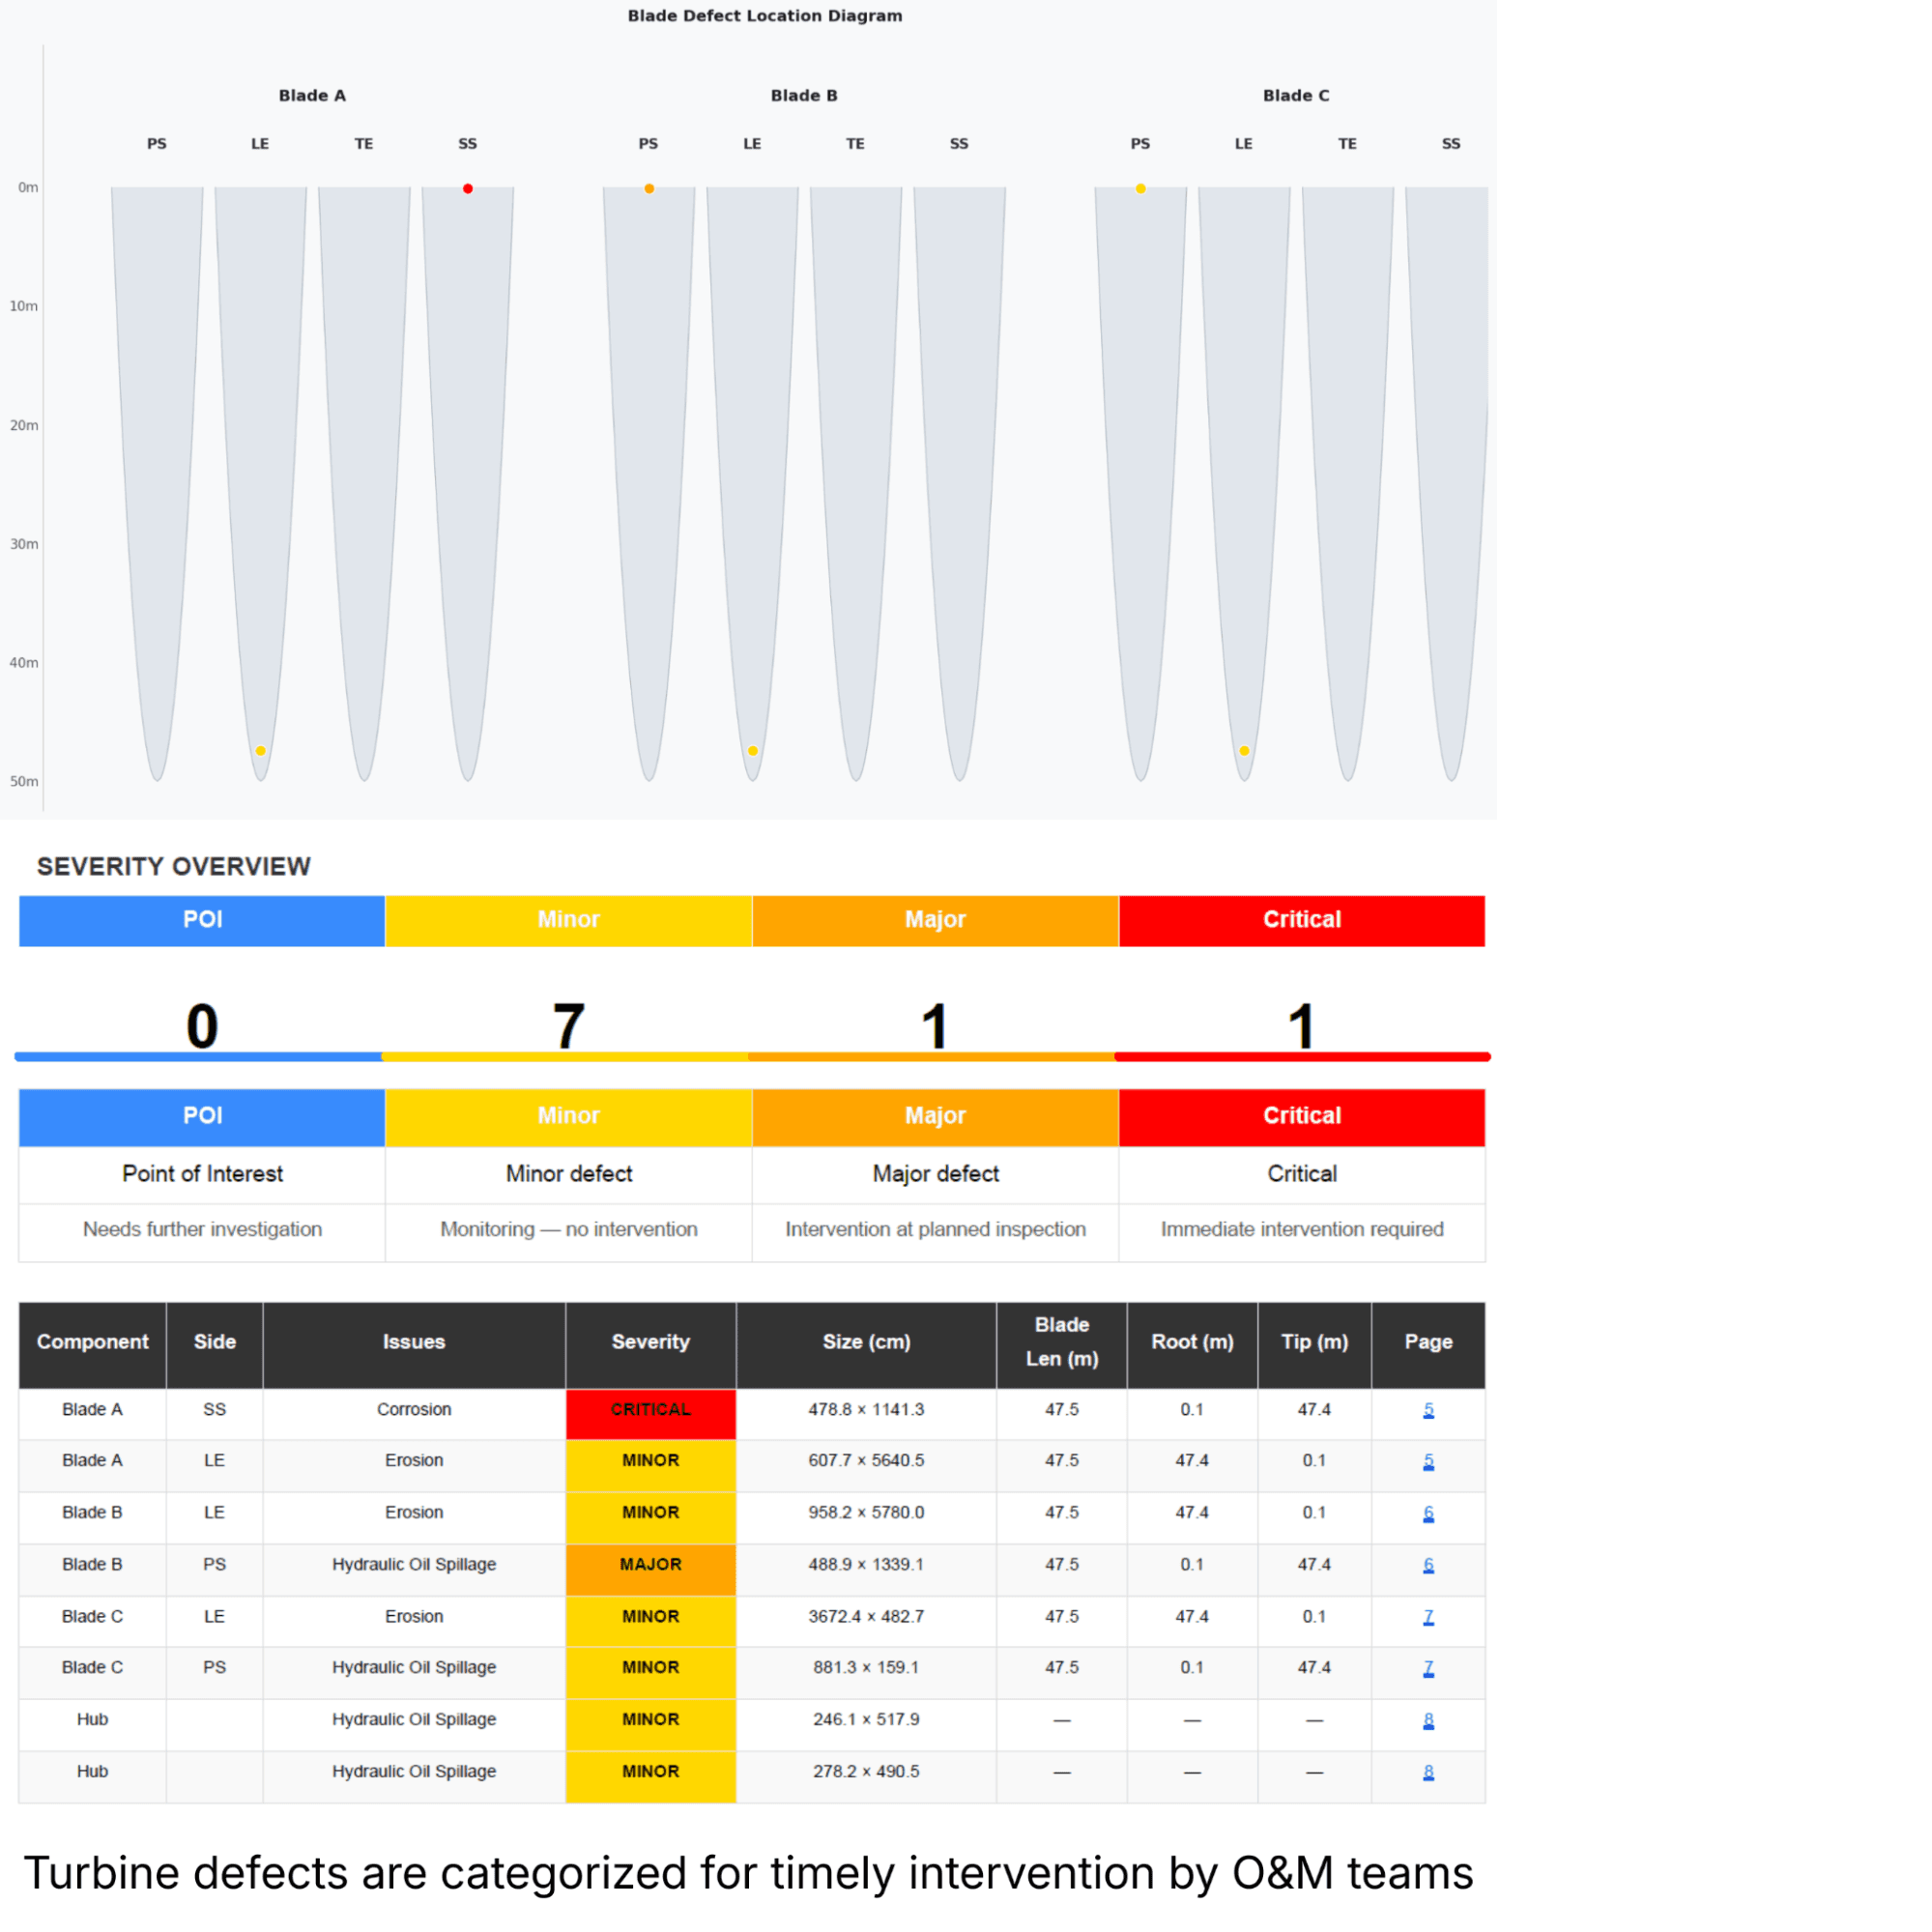
The Tower & Hub: Additional MINOR hydraulic oil spillages were tracked and cataloged for future monitoring.
From Guesswork to Game Plan
The most important part of this structured data isn't just knowing where the defect is—it's knowing what to do about it.
Instead of an engineer spending hours analyzing photos to guess the severity, the platform automatically links the defect to a specific Remedy Action. For the example above, the CRITICAL corrosion on Blade A was immediately flagged for "Immediate intervention required," while the MAJOR oil spill on Blade B was slated for "Intervention at planned inspection". By linking the defects to TaskMapper’s task module, O&M teams are able to plan and prioritize inspections in a timely manner.
Because the data was structured and mapped, the O&M team didn't just get a blurry photo of a blade. They received a precise, actionable breakdown:
Blade A (Suction Side): The scan detected a CRITICAL area of corrosion measuring 478.8 X 1141.3cm.
Blade B (Pressure Side): The system flagged a MAJOR hydraulic oil spillage.
The Tower & Hub: Additional MINOR hydraulic oil spillages were tracked and cataloged for future monitoring.
From Guesswork to Game Plan
The most important part of this structured data isn't just knowing where the defect is—it's knowing what to do about it.
Instead of an engineer spending hours analyzing photos to guess the severity, the platform automatically links the defect to a specific Remedy Action. For the example above, the CRITICAL corrosion on Blade A was immediately flagged for "Immediate intervention required," while the MAJOR oil spill on Blade B was slated for "Intervention at planned inspection". By linking the defects to TaskMapper’s task module, O&M teams are able to plan and prioritize inspections in a timely manner.
This is the difference between being reactive and predictive.
When you tie drone inspections to a living health record for every WTG, you stop finding broken things by accident. You start optimizing maintenance schedules, preventing catastrophic failures, and keeping your incredibly expensive assets spinning.
To know how SenseHawk's TaskMapper platform can deliver next-gen construction and operations monitoring and management to connect your teams, drive efficiency improvements, and optimize processes, drop an email to contact@sensehawk.com.
Read More
To know how SenseHawk's TaskMapper platform can deliver next-gen construction and operations monitoring and management to connect your teams, drive efficiency improvements, and optimize processes, drop an email to contact@sensehawk.com.
Read More
We believe the SenseHawk digital workflow solution for our operating sites will result in substantial productivity gains for our O&M team. It is the type of innovation essential for scaling renewables.
Abhijit Sathe | Co-CEO
SB Energy
We believe the SenseHawk digital workflow solution for our operating sites will result in substantial productivity gains for our O&M team. It is the type of innovation essential for scaling renewables.
Abhijit Sathe | Co-CEO
SB Energy
We believe the SenseHawk digital workflow solution for our operating sites will result in substantial productivity gains for our O&M team. It is the type of innovation essential for scaling renewables.
Abhijit Sathe | Co-CEO
SB Energy
Vice President, Operations
Posted by

Karthik Mekala
Related Tags
Document Management System, Files, Transmittals, Submittal, Documentation
Vice President, Operations
Posted by
Karthik Mekala
Related Tags
Document Management System, Files, Transmittals, Submittal, Documentation
Vice President, Operations
Posted by
April 13, 2026
In the news

TaskMapper Solar
Products
TaskMapper Solar
Products
TaskMapper Solar