

Browse other blogs
The AI-Ready Solar Site, Part 4: From Dashboards to Decision Engines: The Predictive Future

In Part 1, we eliminated unstructured spreadsheets. In Part 2, we gave our data a geospatial map. In Part 3, we killed the "Latency Tax."
But even with structured, mapped, real-time data, there is one final step to achieving a truly AI-ready site: Integration.
The Core Problem: The Fortress of Solitude (Data Silos)
On a traditional solar project, data isn't just messy—it’s imprisoned.
Engineering lives in static CAD designs.
Procurement lives in ERP systems.
Field Teams live in spreadsheets and chat apps.
Planning lives in P6 or MS Project schedules.
When these departments are separated by "soundproof walls," the project suffers from a lack of context. If a shipment of trackers is delayed in the ERP, the construction team doesn't know which specific blocks are impacted until the schedule is manually updated days later. This fragmentation makes it impossible for an AI to see the "big picture." An algorithm cannot optimize a site if it can only see one room of the house at a time.
The TaskMapper Solution: The Integrated "Decision Engine"
To build an AI-ready site, you must move away from isolated modules and toward a unified environment. TaskMapper acts as the central nervous system of the project by physically and digitally linking these previously siloed departments.
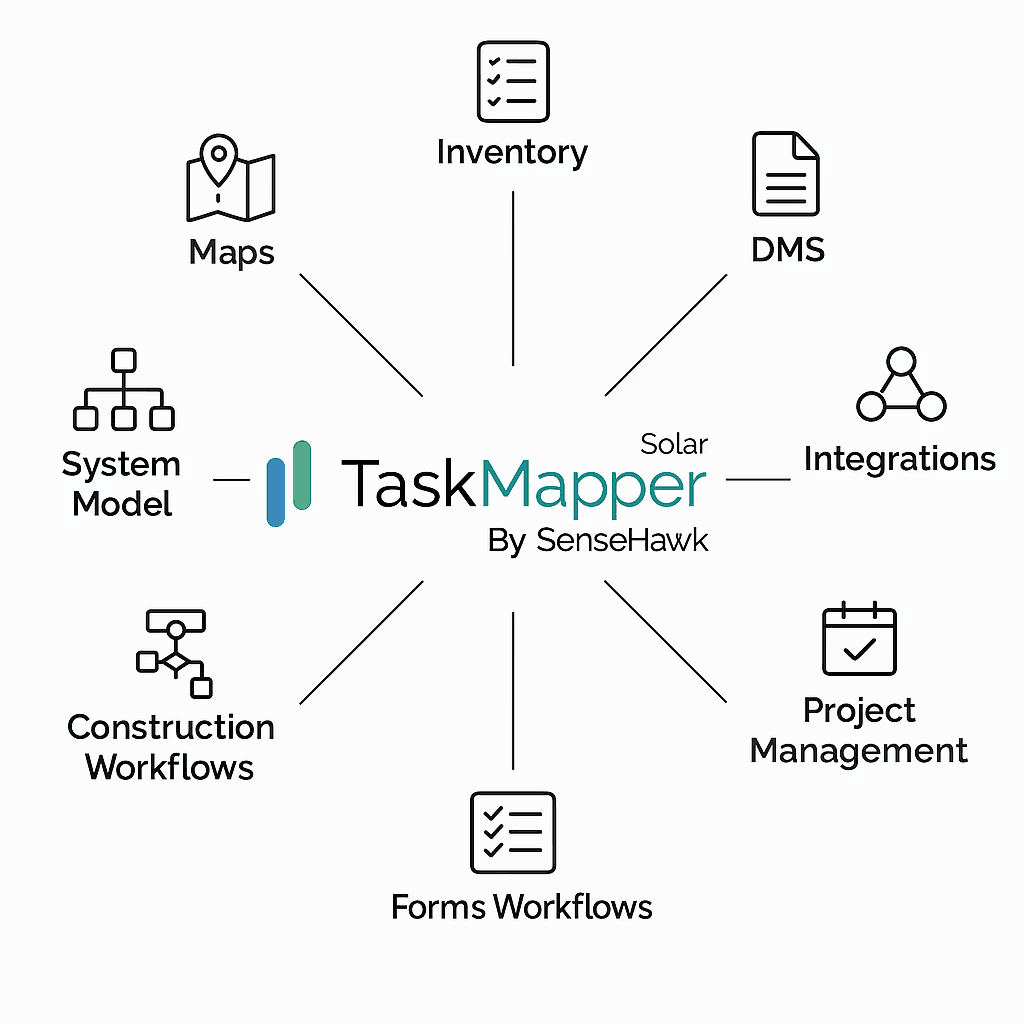
TaskMapper achieves this by combining several core capabilities into a single source of truth:
System Model & Maps: Linking the electrical/mechanical hierarchy directly to geospatial coordinates.
DMS & Files: Ensuring that the latest engineering revisions are instantly accessible to the field crew at the specific asset location.
Inventory & Procurement: Tracking materials from the warehouse to the exact GPS point of installation.
Schedule Integrations: Automatically updating P6/MS Project timelines based on real-time field progress and drone data.
In Part 1, we eliminated unstructured spreadsheets. In Part 2, we gave our data a geospatial map. In Part 3, we killed the "Latency Tax."
But even with structured, mapped, real-time data, there is one final step to achieving a truly AI-ready site: Integration.
The Core Problem: The Fortress of Solitude (Data Silos)
On a traditional solar project, data isn't just messy—it’s imprisoned.
Engineering lives in static CAD designs.
Procurement lives in ERP systems.
Field Teams live in spreadsheets and chat apps.
Planning lives in P6 or MS Project schedules.
When these departments are separated by "soundproof walls," the project suffers from a lack of context. If a shipment of trackers is delayed in the ERP, the construction team doesn't know which specific blocks are impacted until the schedule is manually updated days later. This fragmentation makes it impossible for an AI to see the "big picture." An algorithm cannot optimize a site if it can only see one room of the house at a time.
The TaskMapper Solution: The Integrated "Decision Engine"
To build an AI-ready site, you must move away from isolated modules and toward a unified environment. TaskMapper acts as the central nervous system of the project by physically and digitally linking these previously siloed departments.
TaskMapper achieves this by combining several core capabilities into a single source of truth:
System Model & Maps: Linking the electrical/mechanical hierarchy directly to geospatial coordinates.
DMS & Files: Ensuring that the latest engineering revisions are instantly accessible to the field crew at the specific asset location.
Inventory & Procurement: Tracking materials from the warehouse to the exact GPS point of installation.
Schedule Integrations: Automatically updating P6/MS Project timelines based on real-time field progress and drone data.
The AI-Ready Angle: The Birth of the Decision Engine
When you break down these silos, you stop generating "Static Reports" and start building a "Decision Engine." Future AI agents won't just tell you that you are 10% behind schedule. Because the AI has access to the integrated data—the map, the schedule, the procurement status, and the field QC—it can perform complex cross-functional reasoning:
"Warning: 500 piles in Block 3 are delayed due to subsurface rock (Field Data). This impacts the tracker delivery scheduled for Thursday (Procurement). I suggest re-routing the mechanical crew to Block 5 (Map) to maintain the P6 milestone (Schedule)."
By unifying Engineering, Procurement, and Construction (EPC) into a single digital thread, TaskMapper provides the "contextual brain" that AI needs to move from reporting the past to dictating the future.
To know how SenseHawk's TaskMapper platform can deliver next-gen construction and operations monitoring and management to connect your teams, drive efficiency improvements, and optimize processes, drop an email to contact@sensehawk.com.
Read More
To know how SenseHawk's TaskMapper platform can deliver next-gen construction and operations monitoring and management to connect your teams, drive efficiency improvements, and optimize processes, drop an email to contact@sensehawk.com.
Read More
We believe the SenseHawk digital workflow solution for our operating sites will result in substantial productivity gains for our O&M team. It is the type of innovation essential for scaling renewables.
Abhijit Sathe | Co-CEO
SB Energy
We believe the SenseHawk digital workflow solution for our operating sites will result in substantial productivity gains for our O&M team. It is the type of innovation essential for scaling renewables.
Abhijit Sathe | Co-CEO
SB Energy
We believe the SenseHawk digital workflow solution for our operating sites will result in substantial productivity gains for our O&M team. It is the type of innovation essential for scaling renewables.
Abhijit Sathe | Co-CEO
SB Energy
Vice President, Operations
Posted by

Karthik Mekala
Related Tags
Document Management System, Files, Transmittals, Submittal, Documentation
Vice President, Operations
Posted by
Karthik Mekala
Related Tags
Document Management System, Files, Transmittals, Submittal, Documentation
Vice President, Operations
Posted by
March 30, 2026
In the news

TaskMapper Solar
Products
TaskMapper Solar
Products
TaskMapper Solar