Browse other blogs
The Death of the Static Dashboard: Why Solar Construction Needs a Decision Engine, Not Just a Report
We need to talk about the "Monday Morning Report."
You know the one. It arrives in your inbox as a PDF or a heavy slide deck. It’s filled with beautiful charts, S-curves, and completion percentages. It looks professional, but it has a fatal flaw: by the time you read it, the data is already four days old.
Worse, it only answers one question: “What happened last week?”
It doesn’t tell you why a specific block is stalling. It doesn’t tell you which contractor is driving the sudden spike in NCRs. And it definitely doesn't tell you what will happen next week if you don't intervene today.
So, what do your planners do? They resort to the industry standard workaround: They hit "Export to Excel," spend four hours wrangling disparate data, and build their own "version of the truth."
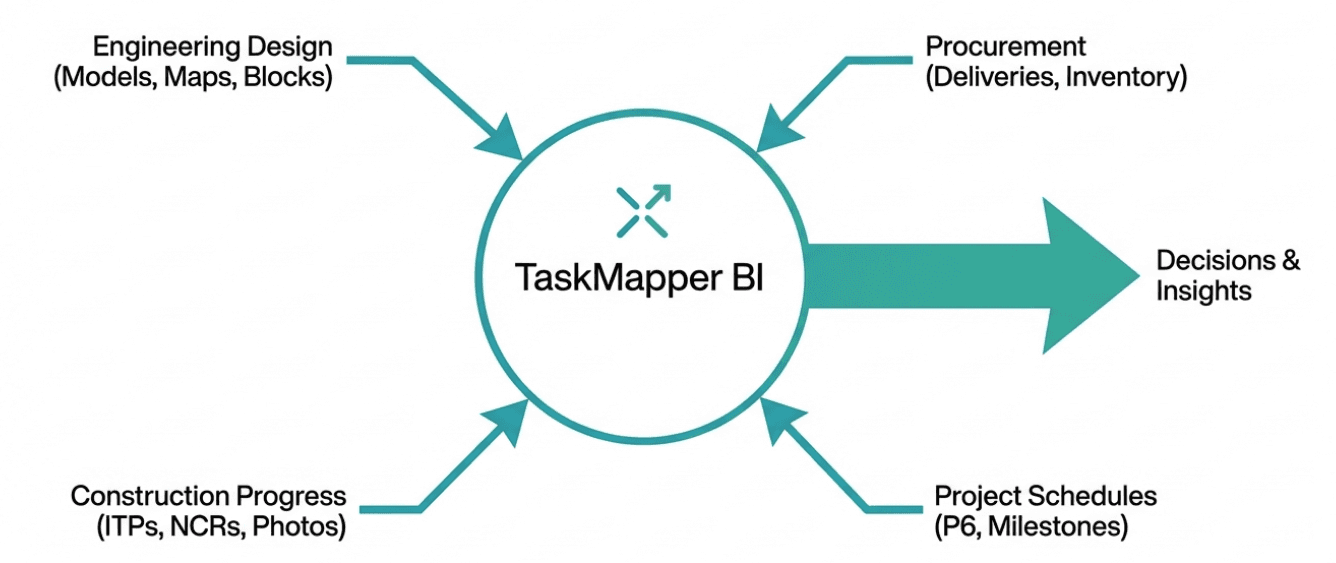
This inefficiency is exactly why we built TaskMapper BI.
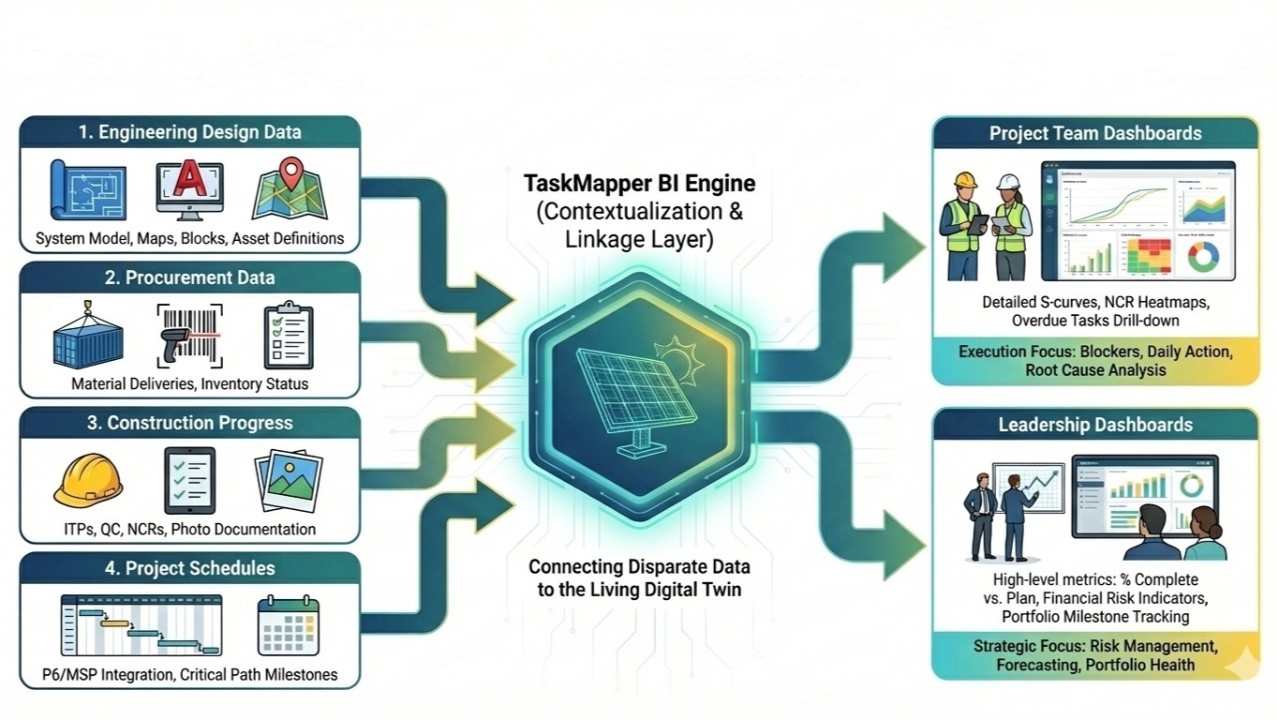
For Leadership: Strategic Focus
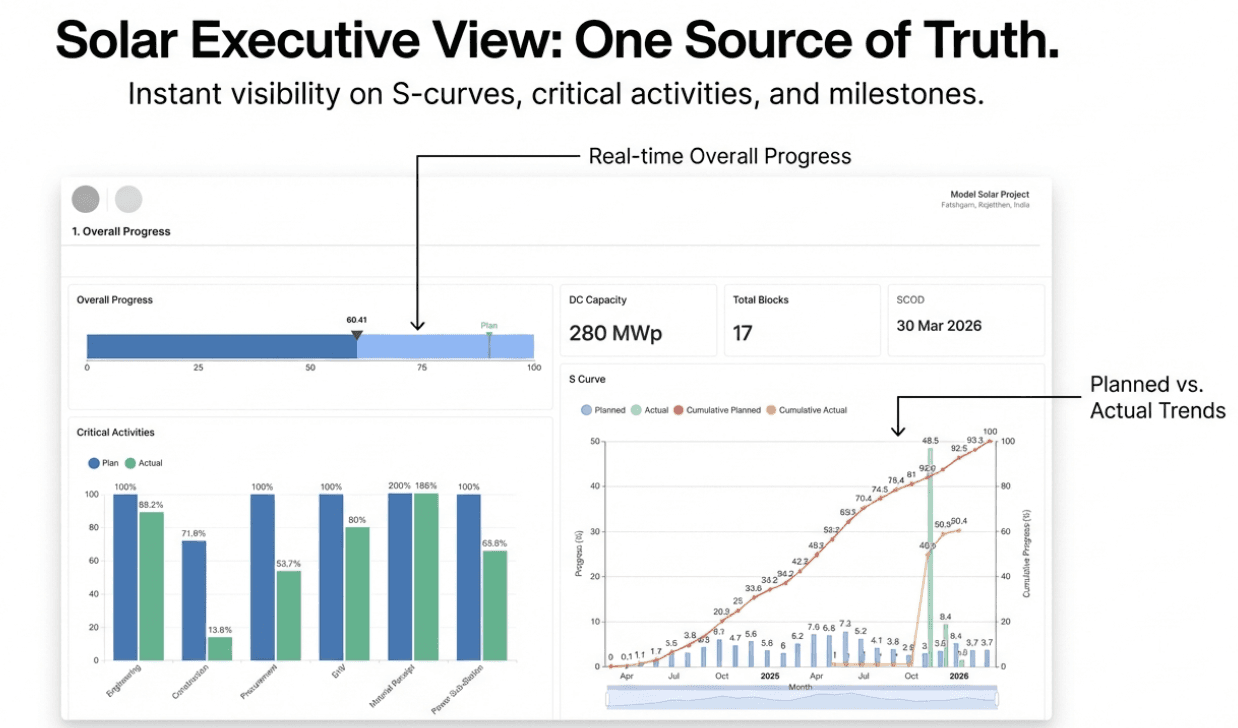
Executives need a real-time view of portfolio health without waiting for weekly slide decks.
Portfolio Health: See instantly if projects are trending toward milestone completion.
Risk Mitigation: Identify if procurement delays are creating future risk, allowing for proactive intervention rather than reactive firefighting.
The End of "Version Control" Hell
We are all tired of files named Project_Schedule_Final_v3_UPDATED.xlsx.
Because TaskMapper BI is built on top of the live TaskMapper platform and integrated data sources, everyone—from the site supervisor to the VP of Construction—is looking at the same reality. There is only one version of the truth, and it is updated in real-time.