Drone Analytics for Solar: How It Improves Construction Monitoring and O&M
Still tracking solar builds and PV defects on foot? Drone analytics maps progress, flags hotspots, and prioritizes fixes based on power loss. See how.
Team SenseHawk
Published on
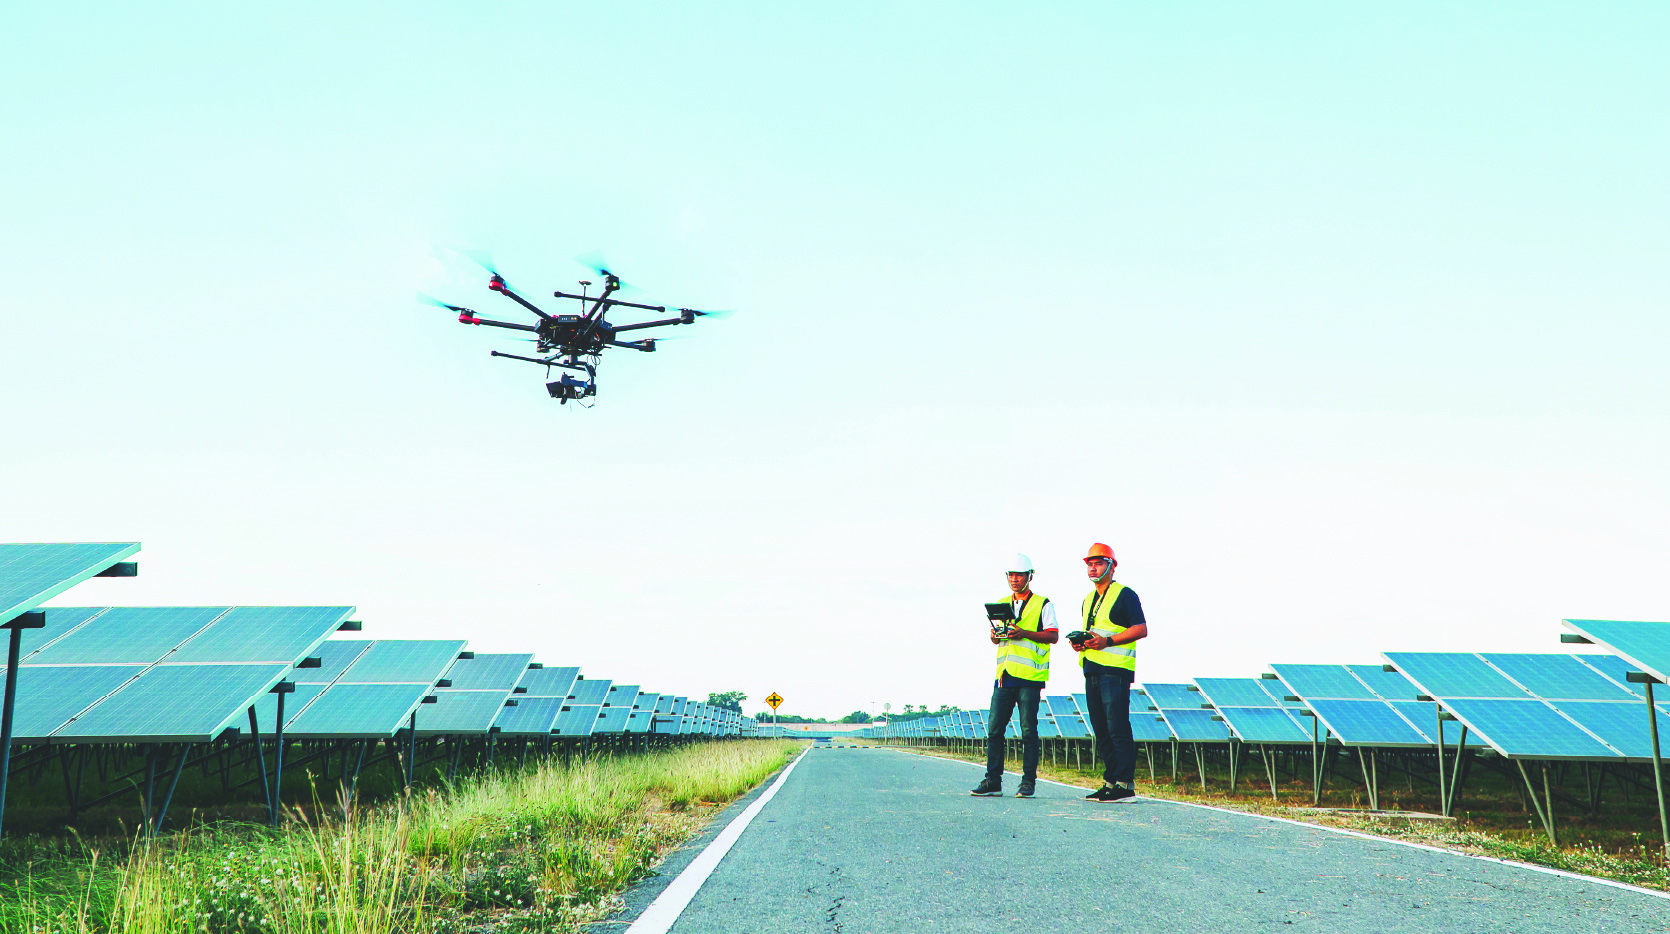
Drone analytics gives EPCs, asset owners and O&M teams a faster, more accurate way to monitor utility-scale solar sites than manual inspections. Drones equipped with high-resolution cameras and thermal sensors capture imagery that software and AI turn into precise, real-time data, from tracking installation progress to detecting panel defects across large-scale solar installations.
Key Takeaways
Drone-captured imagery, processed with AI, turns raw site data into maps, measurements and defect data for solar construction and O&M teams.
Drones cover large sites faster and more consistently than manual walkdowns, while keeping crews out of hazardous areas.
On construction, drone analytics tracks installed vs. planned quantities and flags as-built deviations from design before they turn into rework.
On O&M, thermal drone surveys and AI classification detect and prioritize panel defects by potential power loss, so teams fix what matters first.
What Is Drone Analytics in Solar?
Drone analytics in solar is the process of capturing drone imagery of a site and processing it with software and AI into maps, measurements and defect data that construction and O&M teams can act on.
Types of Drone Data Used on Solar Sites
RGB / orthomosaic imagery: a single, stitched high-resolution map of the site used to track layout, progress and component locations.
Thermal (IR) imagery: captures temperature variance across modules and equipment to reveal hotspots and electrical faults.
Elevation / DSM (Digital Surface Model) data: maps site topography and grading to support drainage, layout and earthwork planning.
Drone Analytics vs Manual Inspection
Drone analytics and manual, ground-based inspection differ most in coverage, consistency and safety:
Parameter
Drone Analytics
Manual Inspection
Site coverage per day
Tens to hundreds of acres in a single flight
Limited to what a crew can physically walk
Data consistency
Standardized, geotagged imagery every survey
Varies by inspector and conditions
Crew safety
No need to access energized or hazardous areas
Personnel exposed to electrical and terrain risks
Time to report
Maps and defect data available within days
Manual logging and reporting takes longer
Traceability to components
Findings geo-located to exact trackers, modules or inverters
Dependent on manual notes and memory
Repeatability
Same flight path and parameters every survey
Difficult to replicate exactly each time
Drone Analytics in Solar Construction Monitoring
Drones are an invaluable tool for modern construction management. They provide comprehensive coverage of large construction sites, capturing high-resolution images and geotagged data to track installations such as trenches, inverters, and access roads. This enables frequent monitoring without disrupting ongoing work, ensuring adherence to project timelines and specifications.
Their ability to deliver detailed data for progress reports helps project managers tackle issues promptly, allocate resources efficiently, and maintain safety by reducing the need for personnel to access hazardous areas.
Progress Tracking Across Construction Phases
Drone flights follow the natural build sequence (grading, piling, racking, modules, electrical), so progress on trenches, piles, trackers and roads is visible at every phase, not just at handover.
Component-Level Quantities and Classification
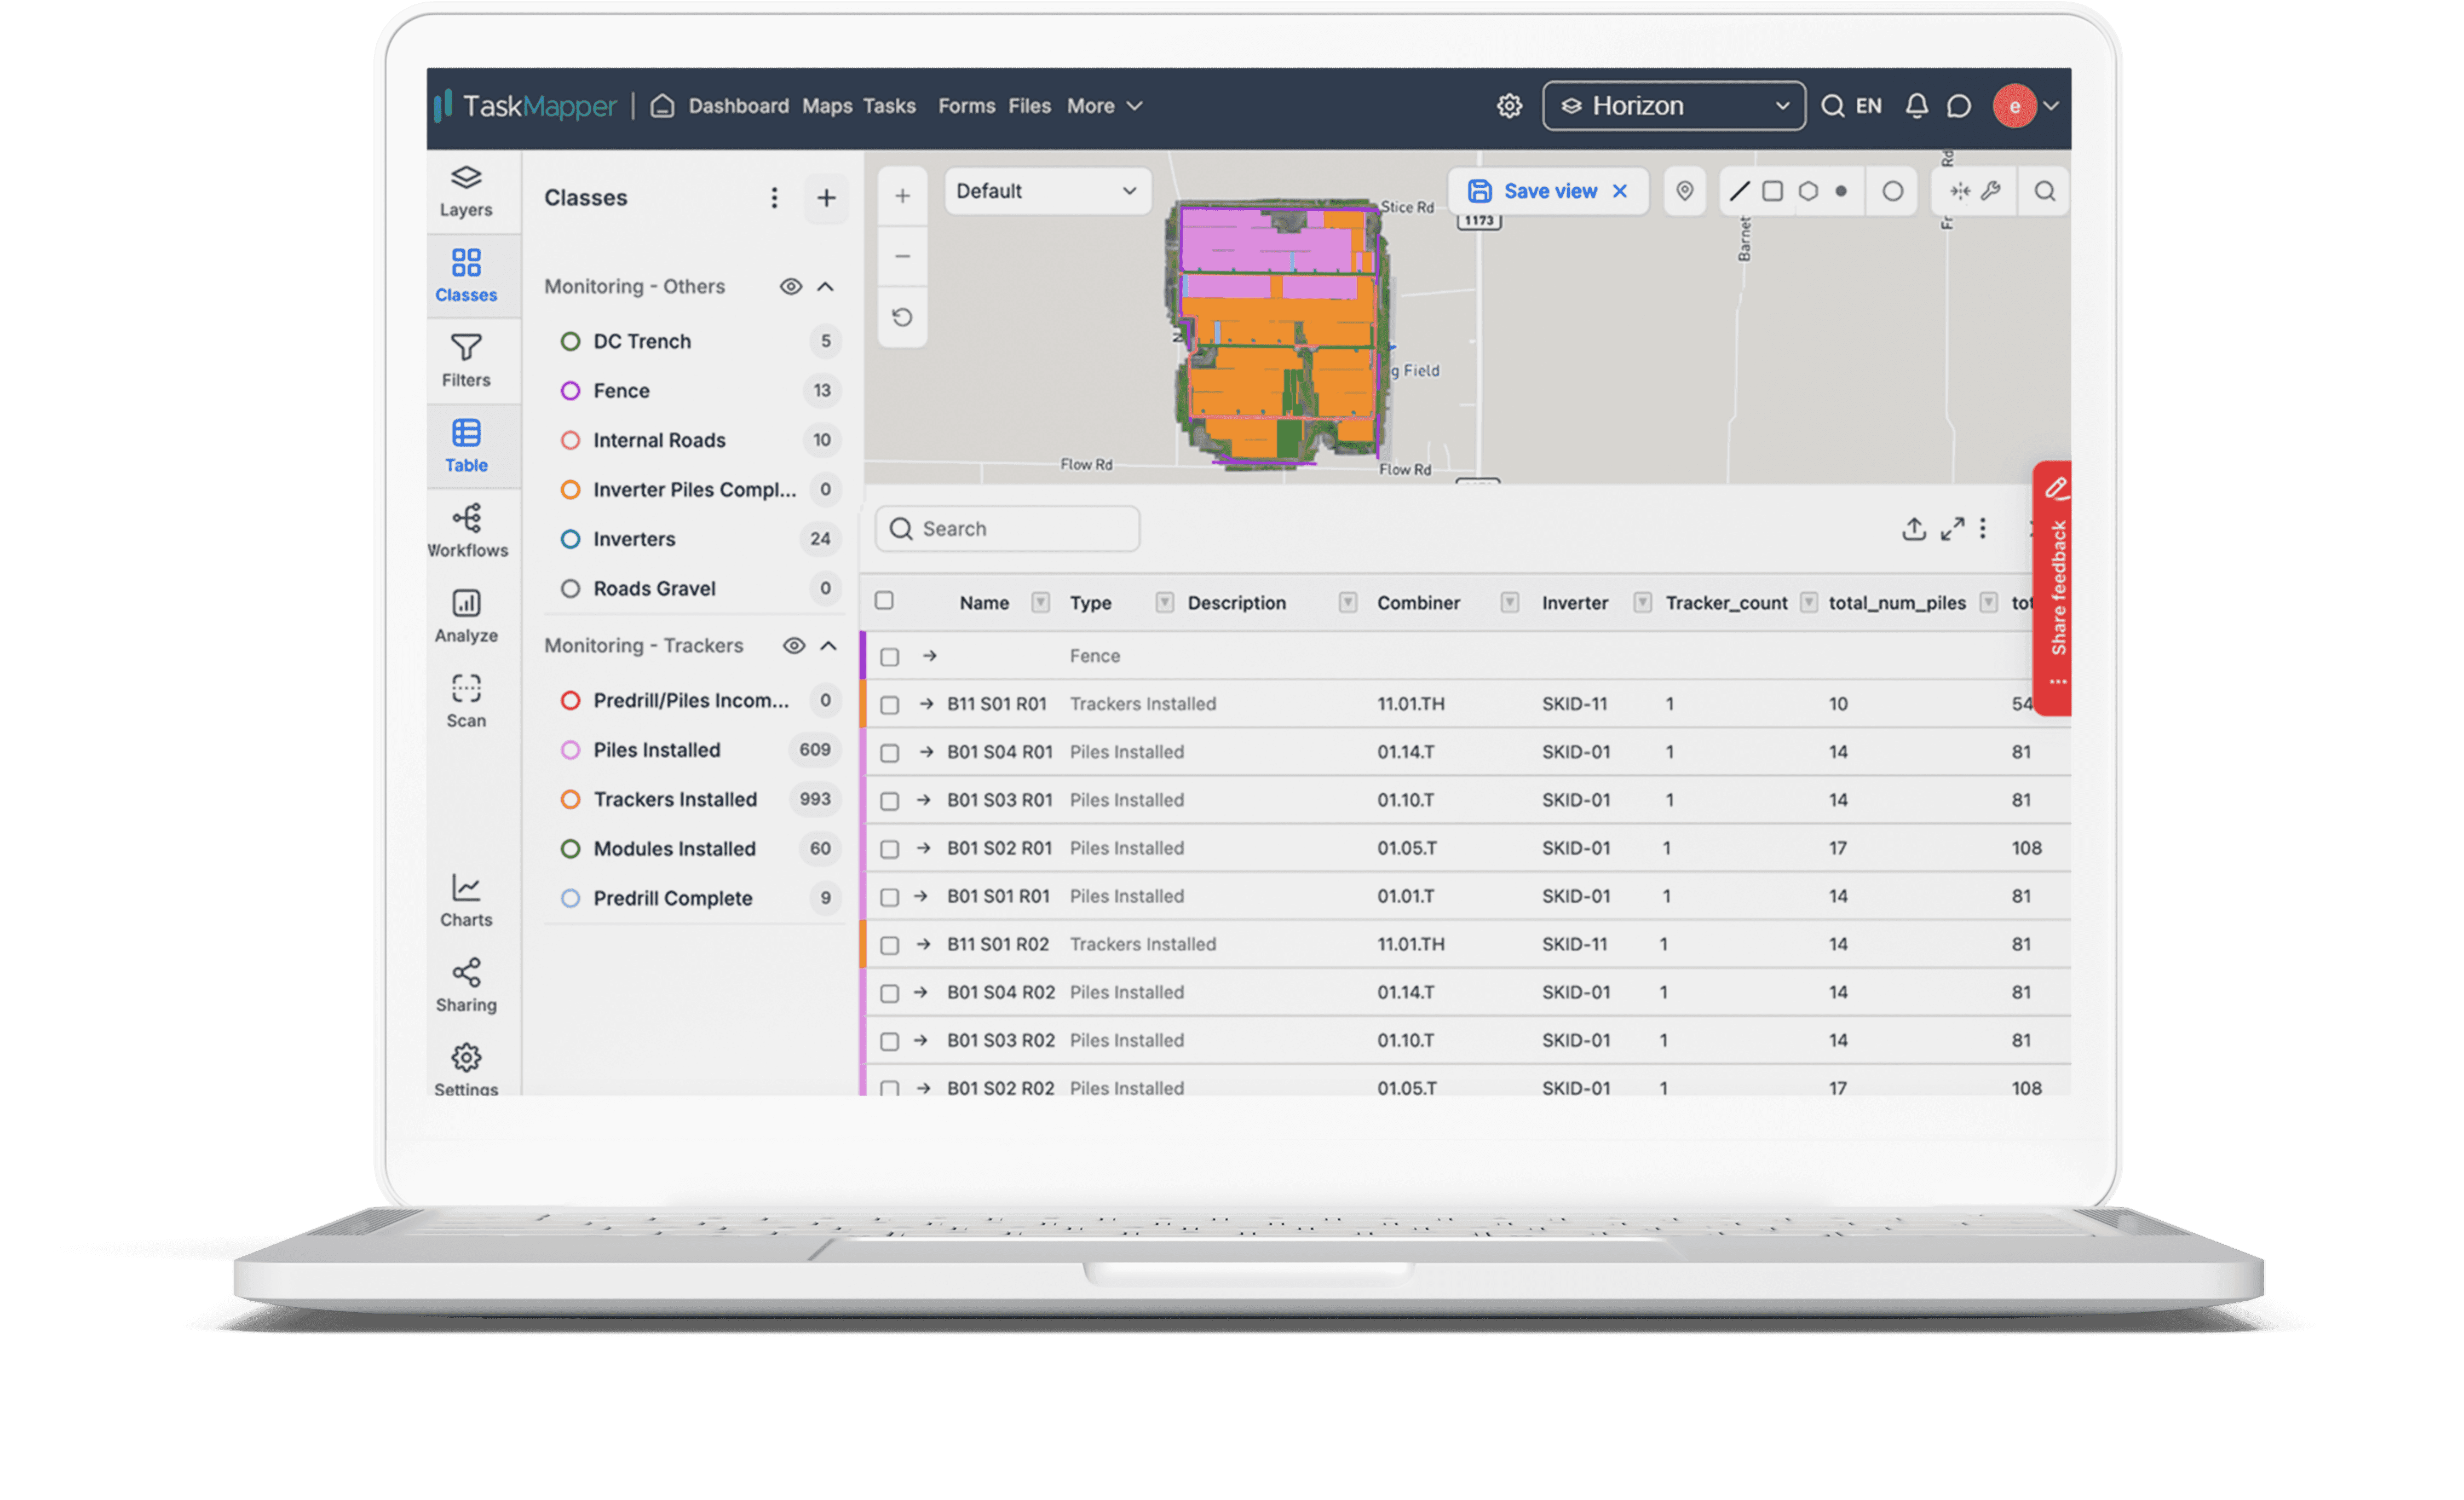
Maps paired with data tables compare installed vs. planned counts for trackers, piles, and modules, giving project managers an accurate, quantified view of installation progress rather than a visual estimate.
As-Built vs Design Deviations and QA/QC
Overlaying drone-captured maps on the design (CAD/IFC) surfaces as-built deviations, such as misaligned piles, incorrect spacing, or missed components, early enough to correct them before they turn into costly rework. See how this fits into a broader QA/QC workflow in our QC software for solar construction.
Drone Analytics in Solar O&M
During operations, using drones equipped with thermal imaging sensors is a fast and efficient way to inspect expansive solar arrays to detect defects like hotspots and shading. Regular drone surveys identify anomalies early, enabling proactive maintenance that minimizes downtime and prevents expensive equipment failures.
Drone data integrates seamlessly into asset management systems, giving stakeholders a complete view of the asset’s condition and performance. This holistic approach supports long-term planning, operational reliability, and better investment decisions.
Thermal Inspections and Defect Detection
Thermal drone surveys, guided by standards such as IEC TS 62446-3 for outdoor thermographic inspection of PV plants, catch a wide range of defect types, including:
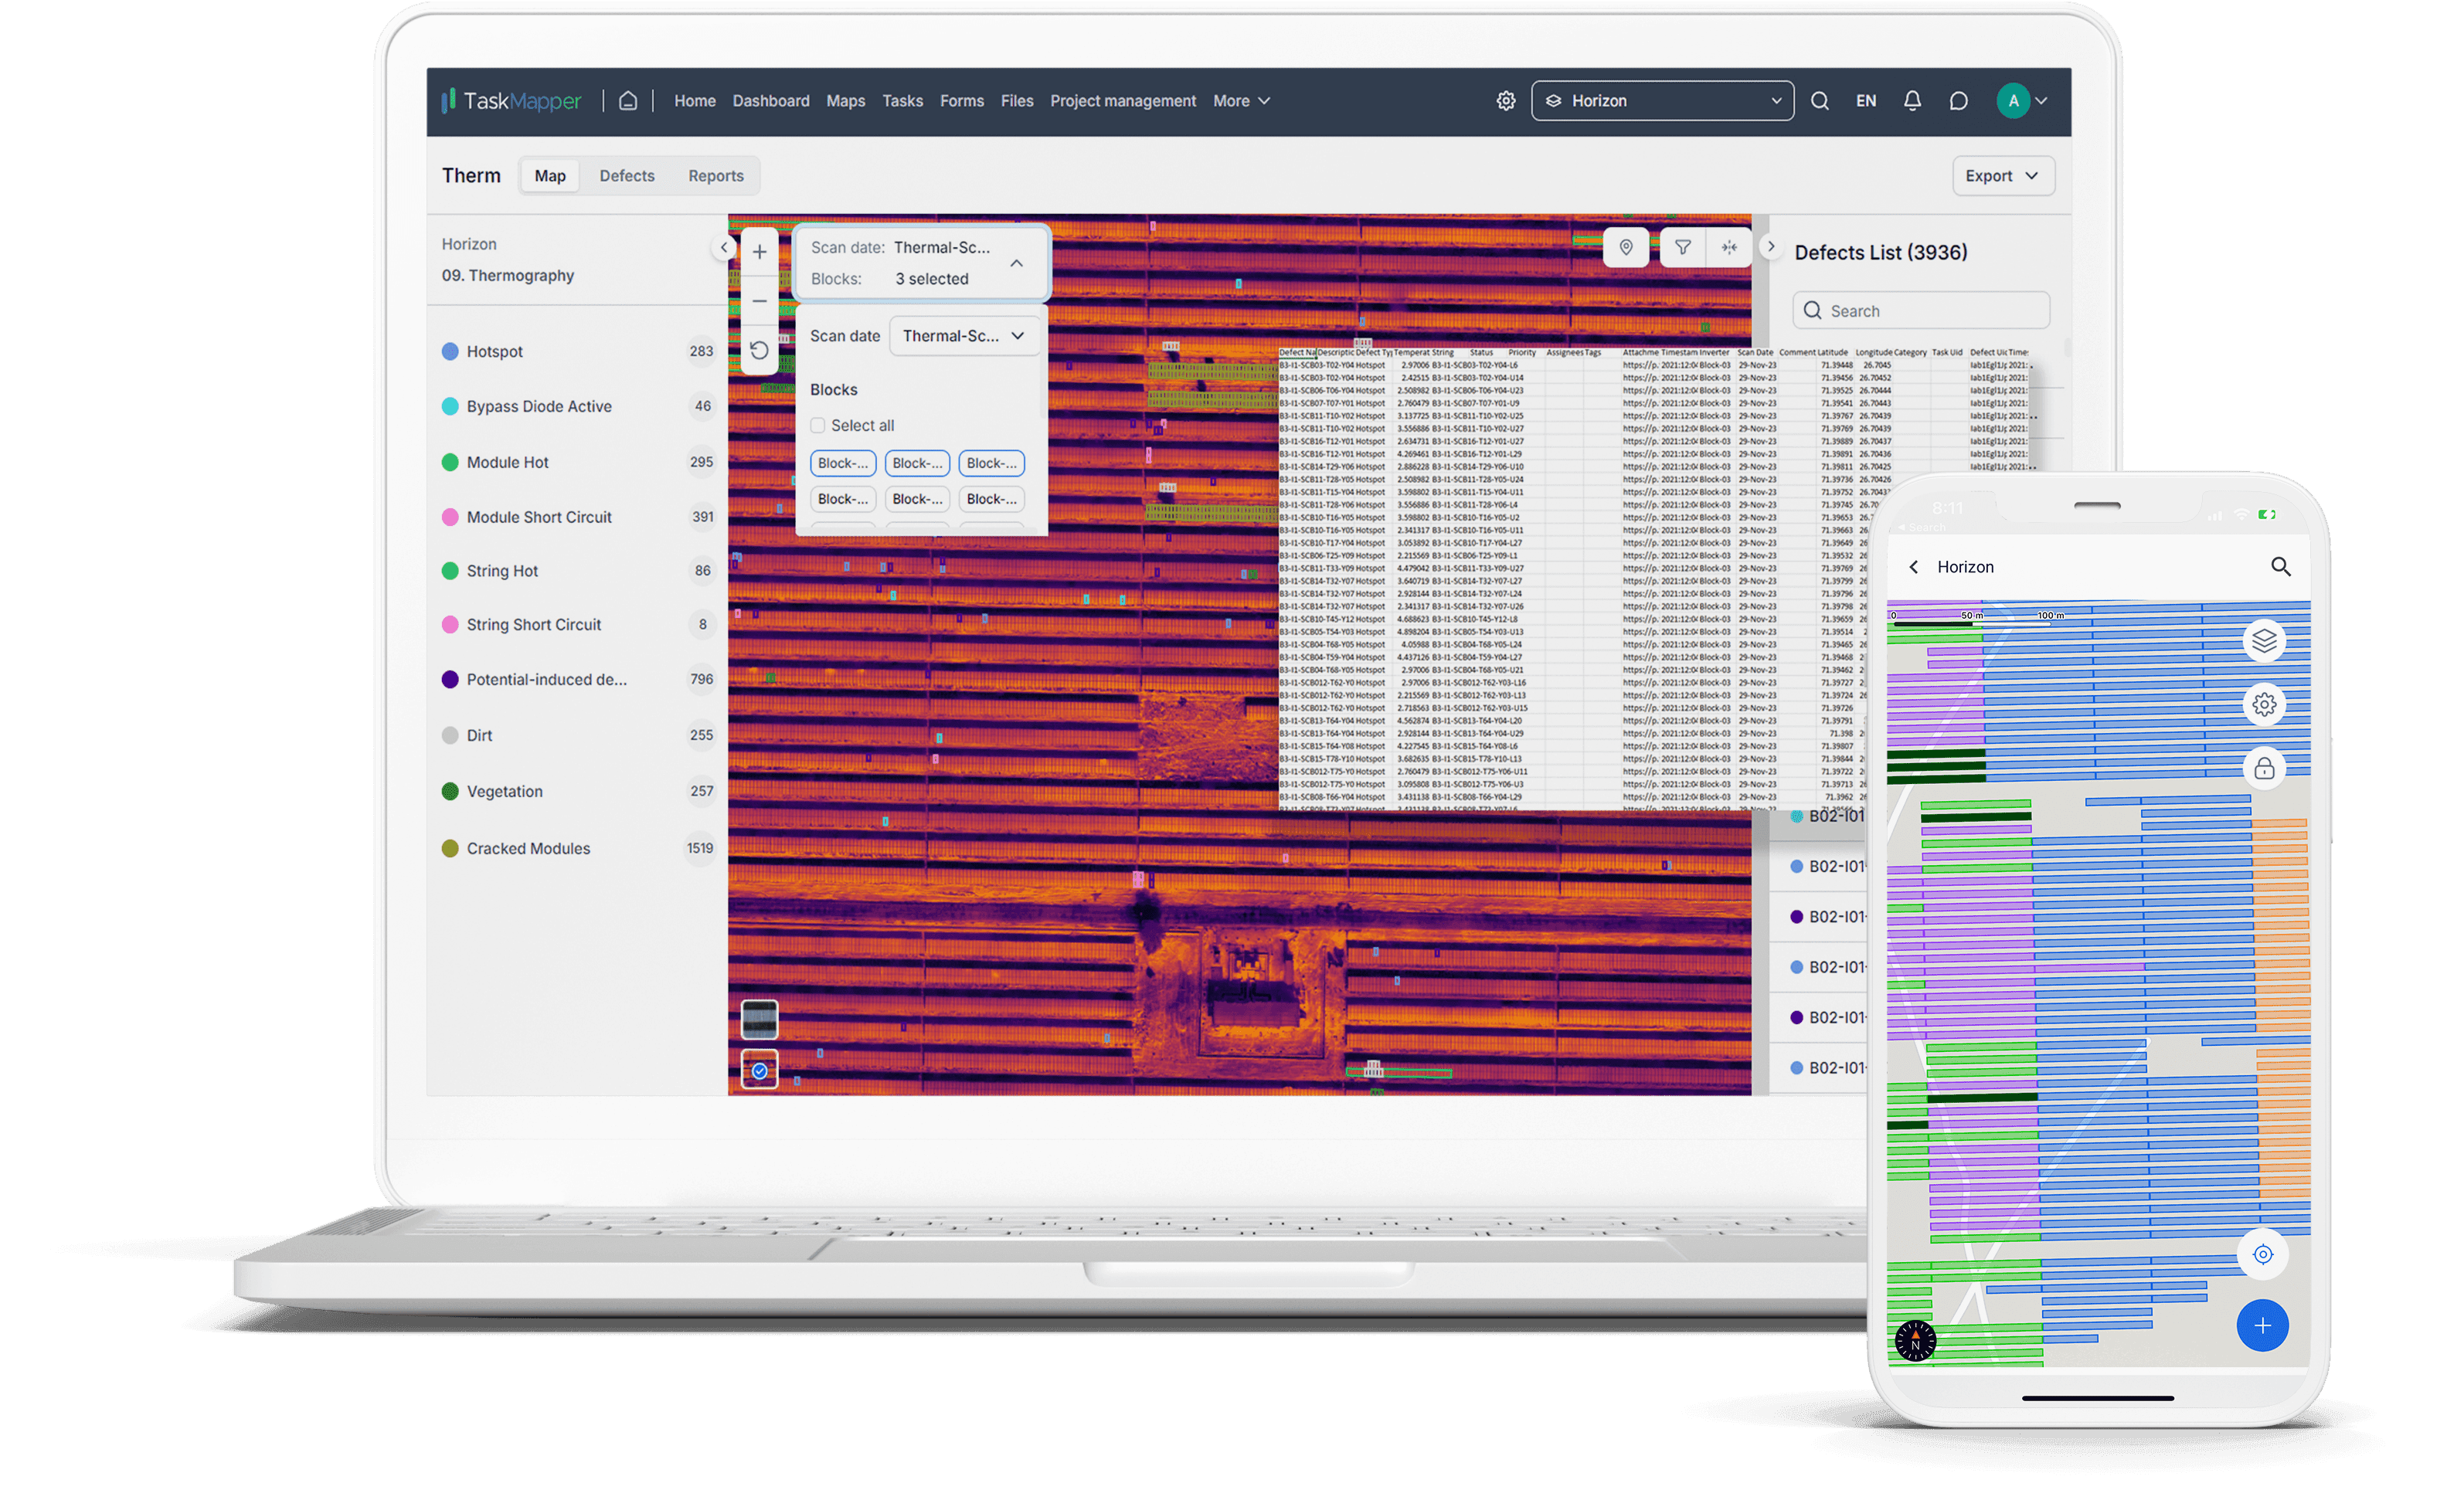
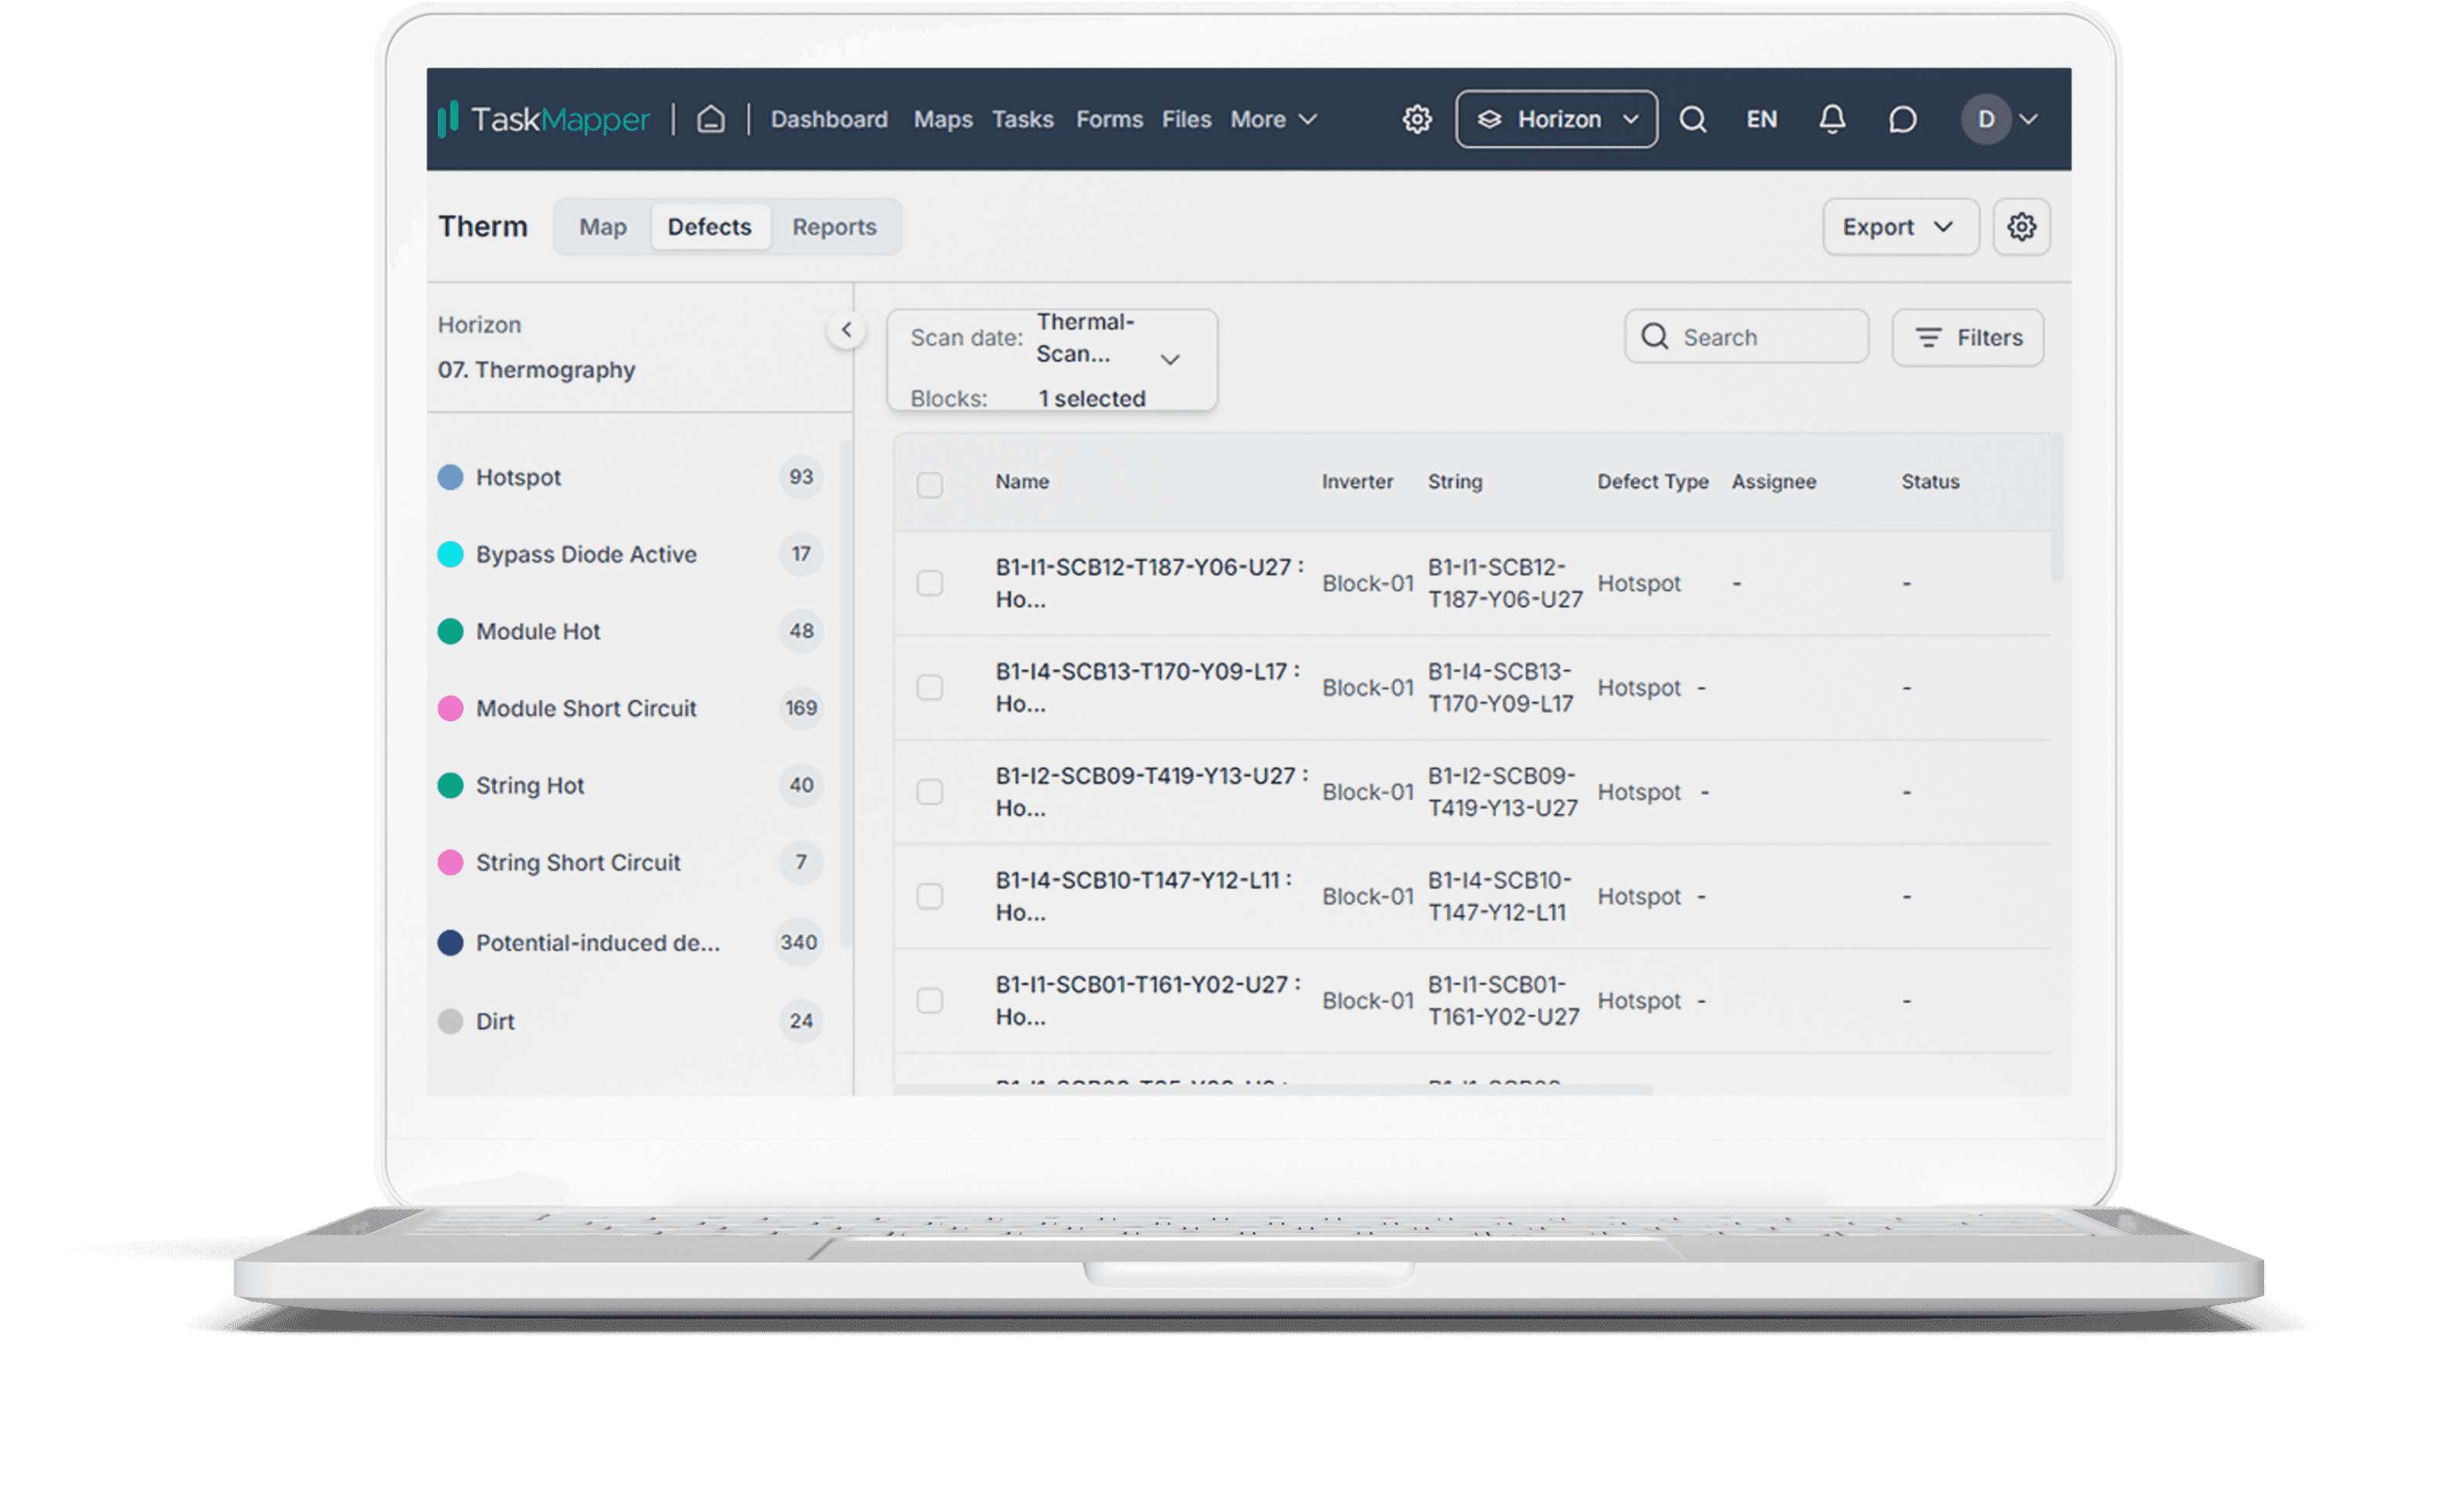
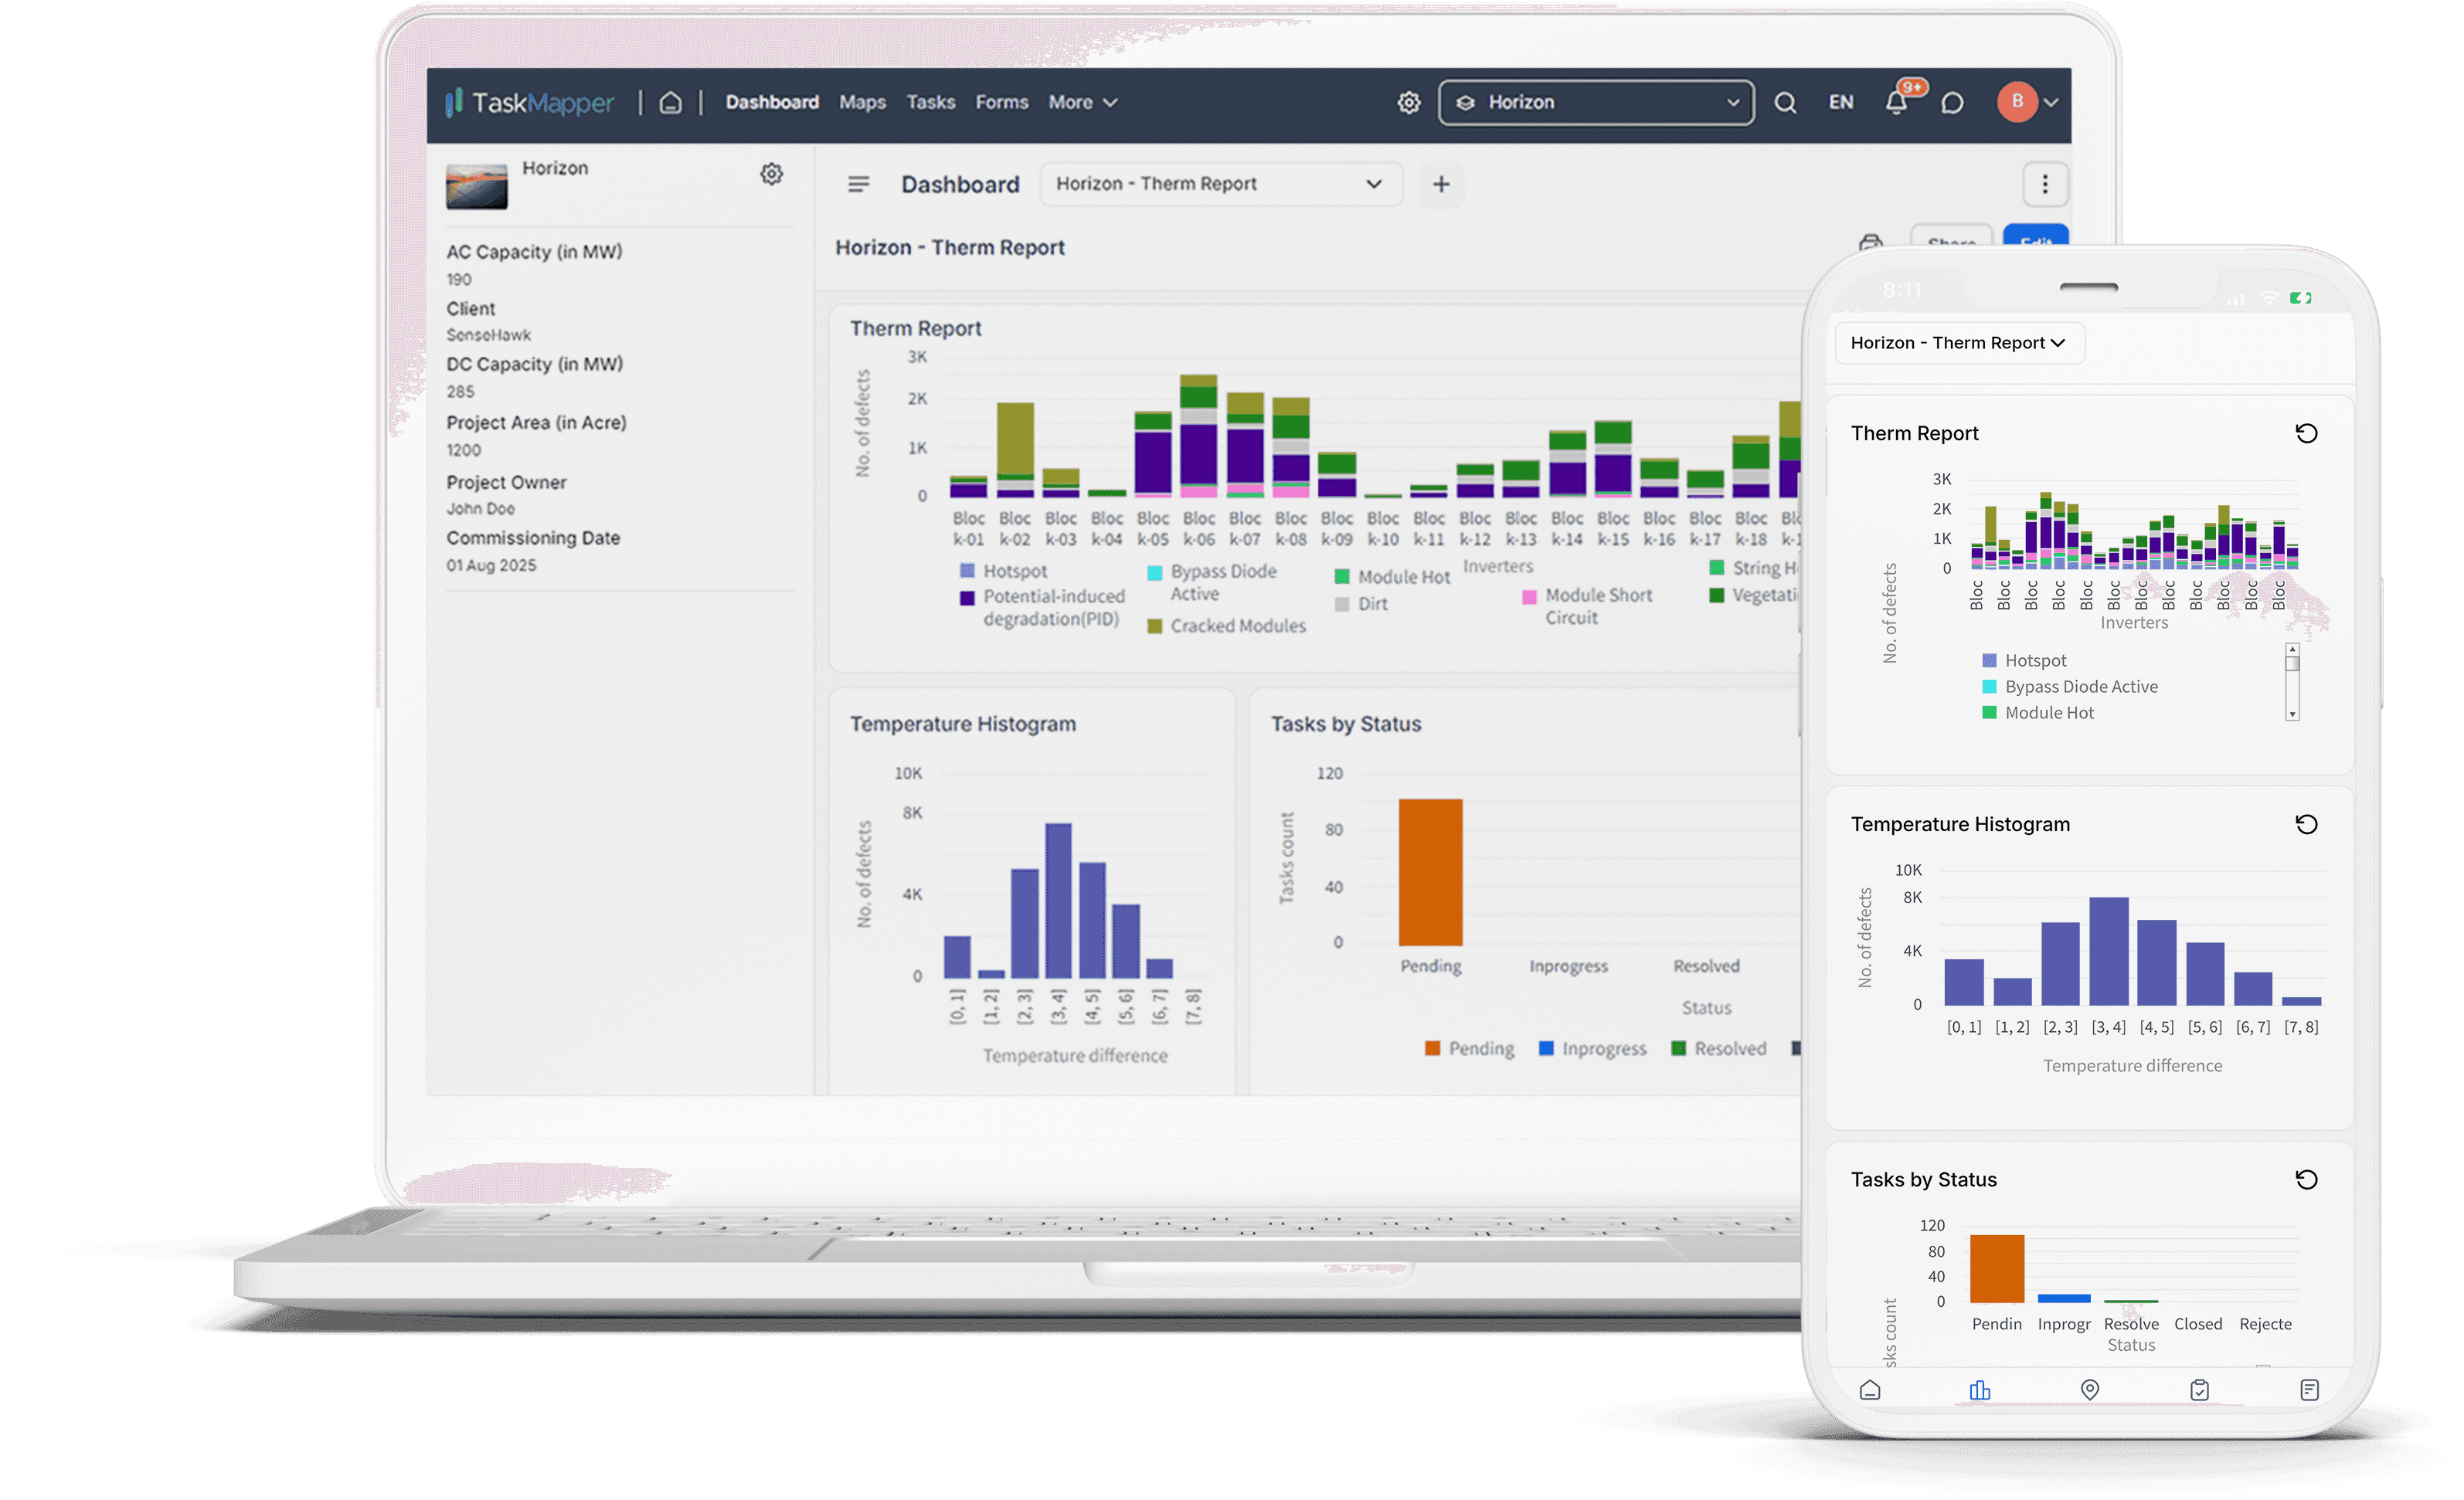
TaskMapper's Therm module uses AI to identify and categorize over 20 different types of defects, then prioritizes anomalies by temperature differential, potential power loss, and defect severity, so O&M teams work by impact instead of a flat, unranked list.
Remediation, Reporting and Portfolio Visibility
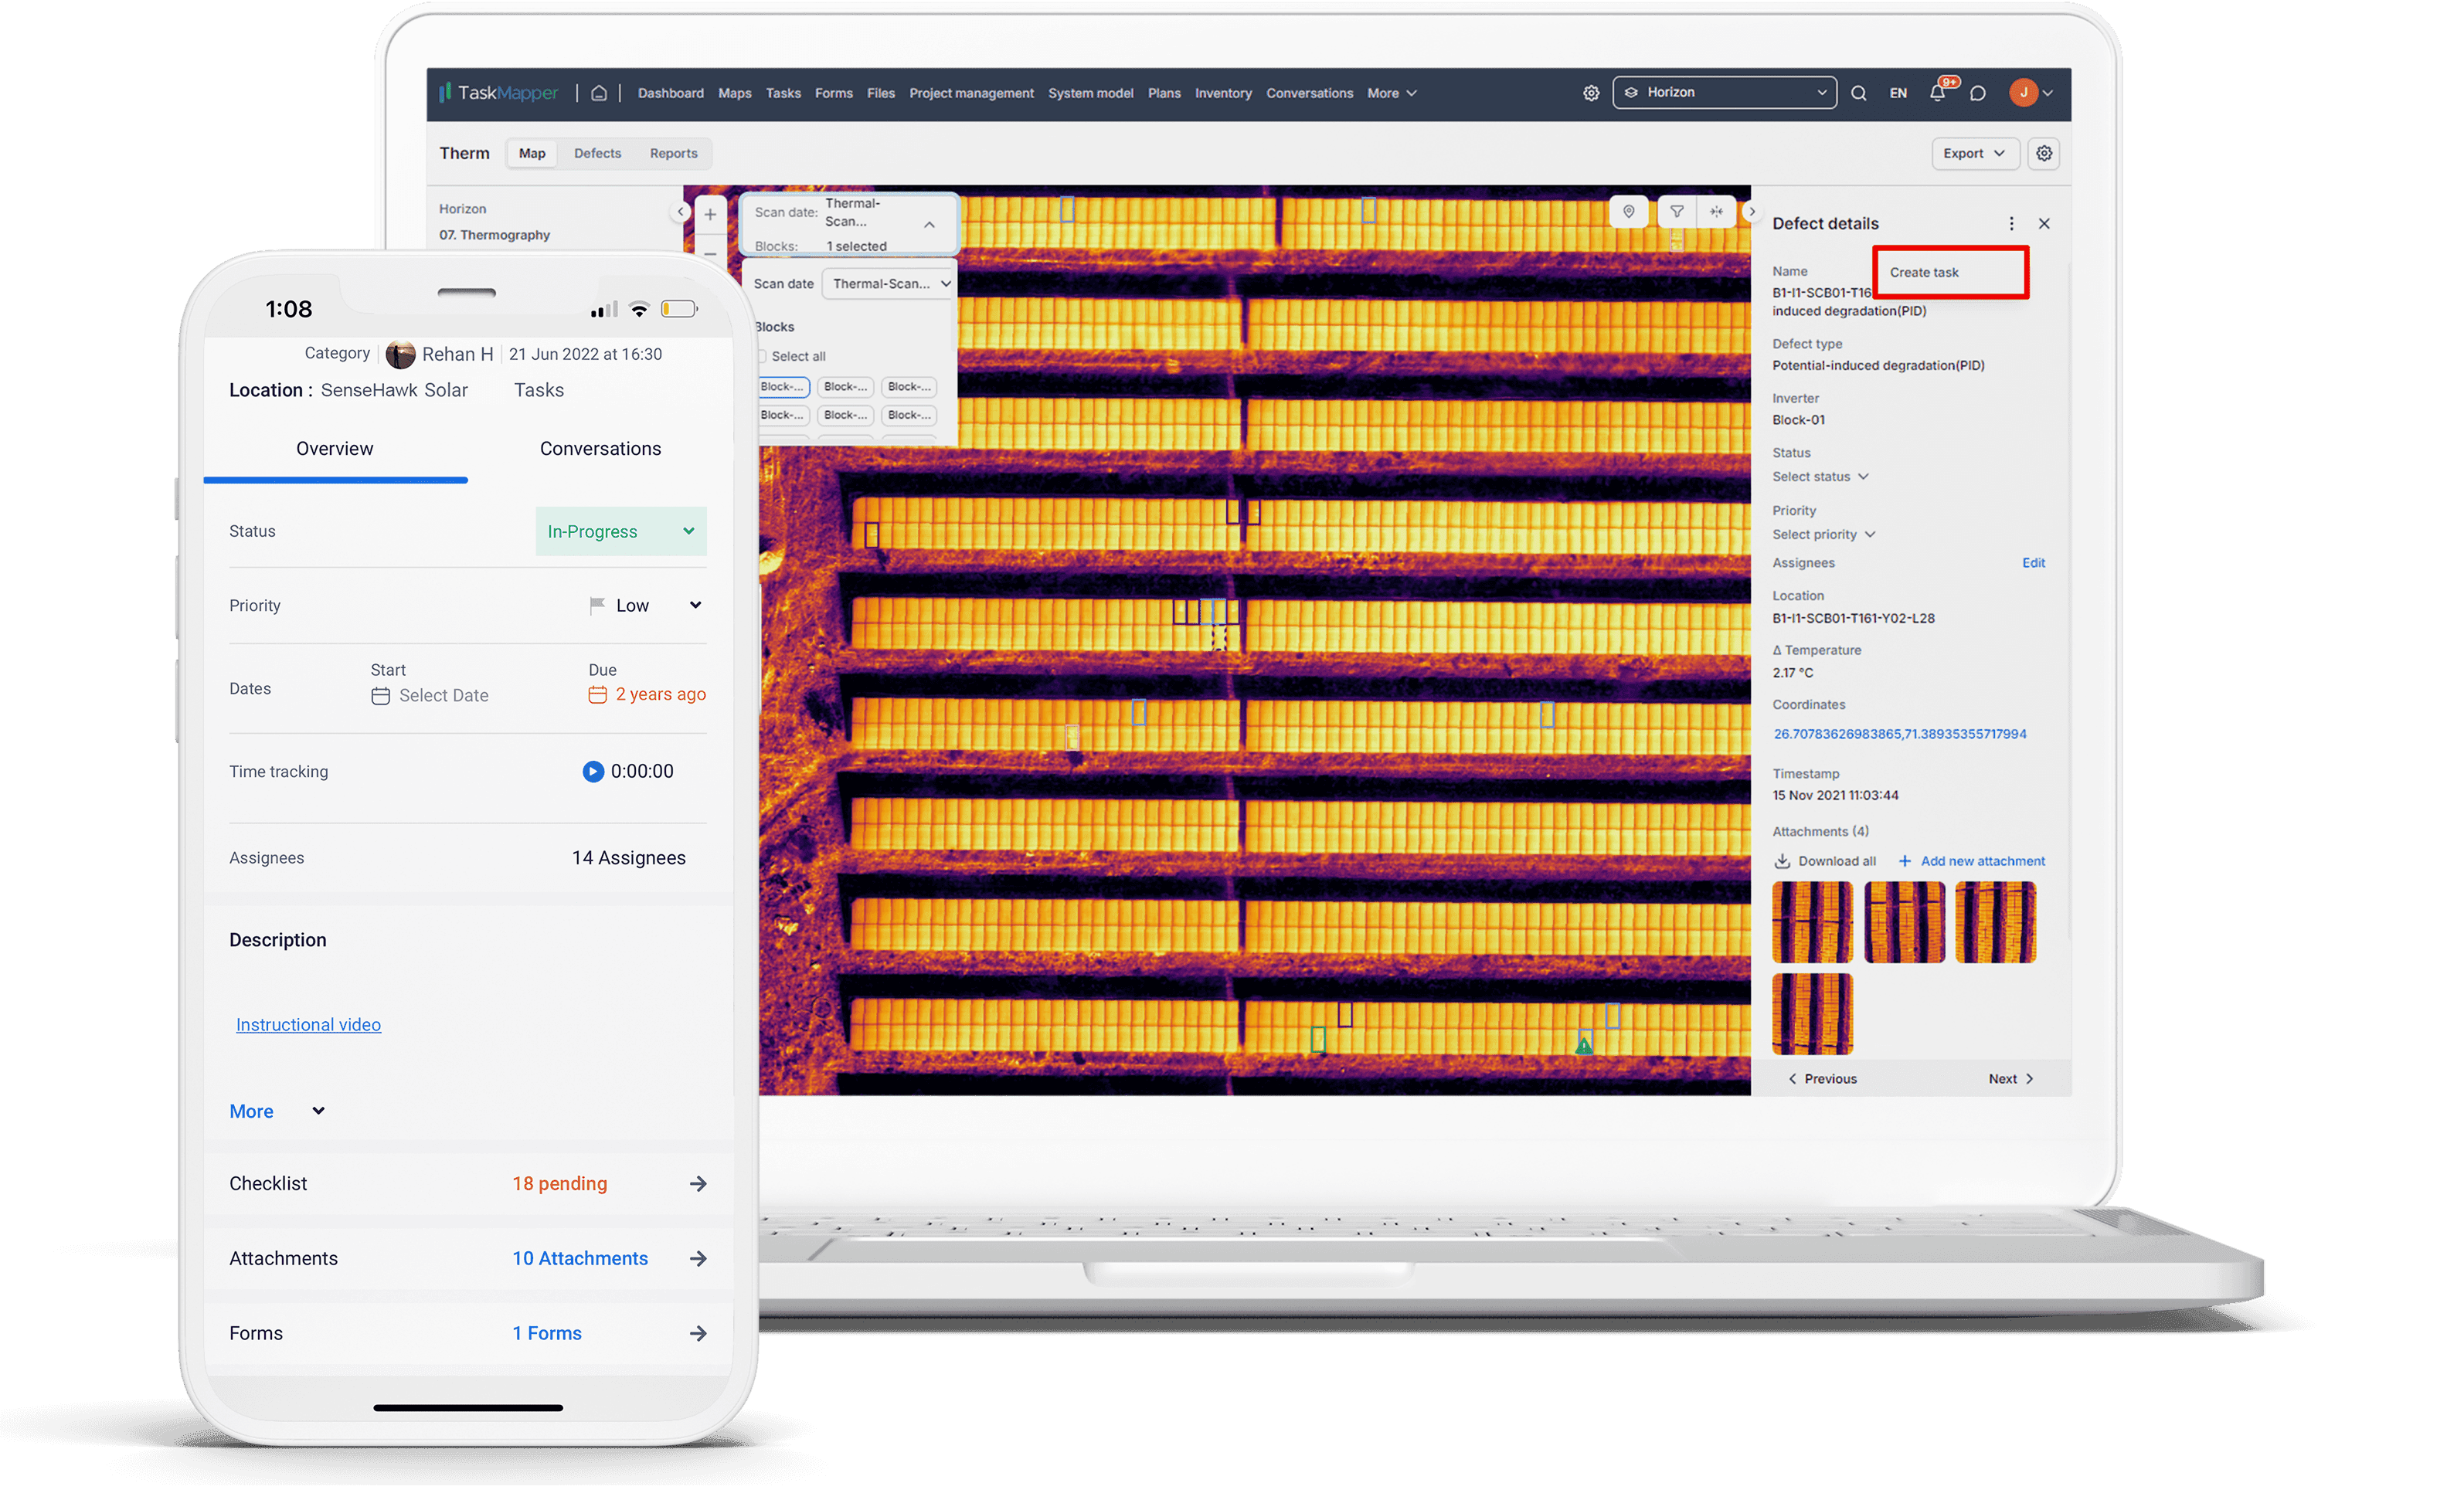
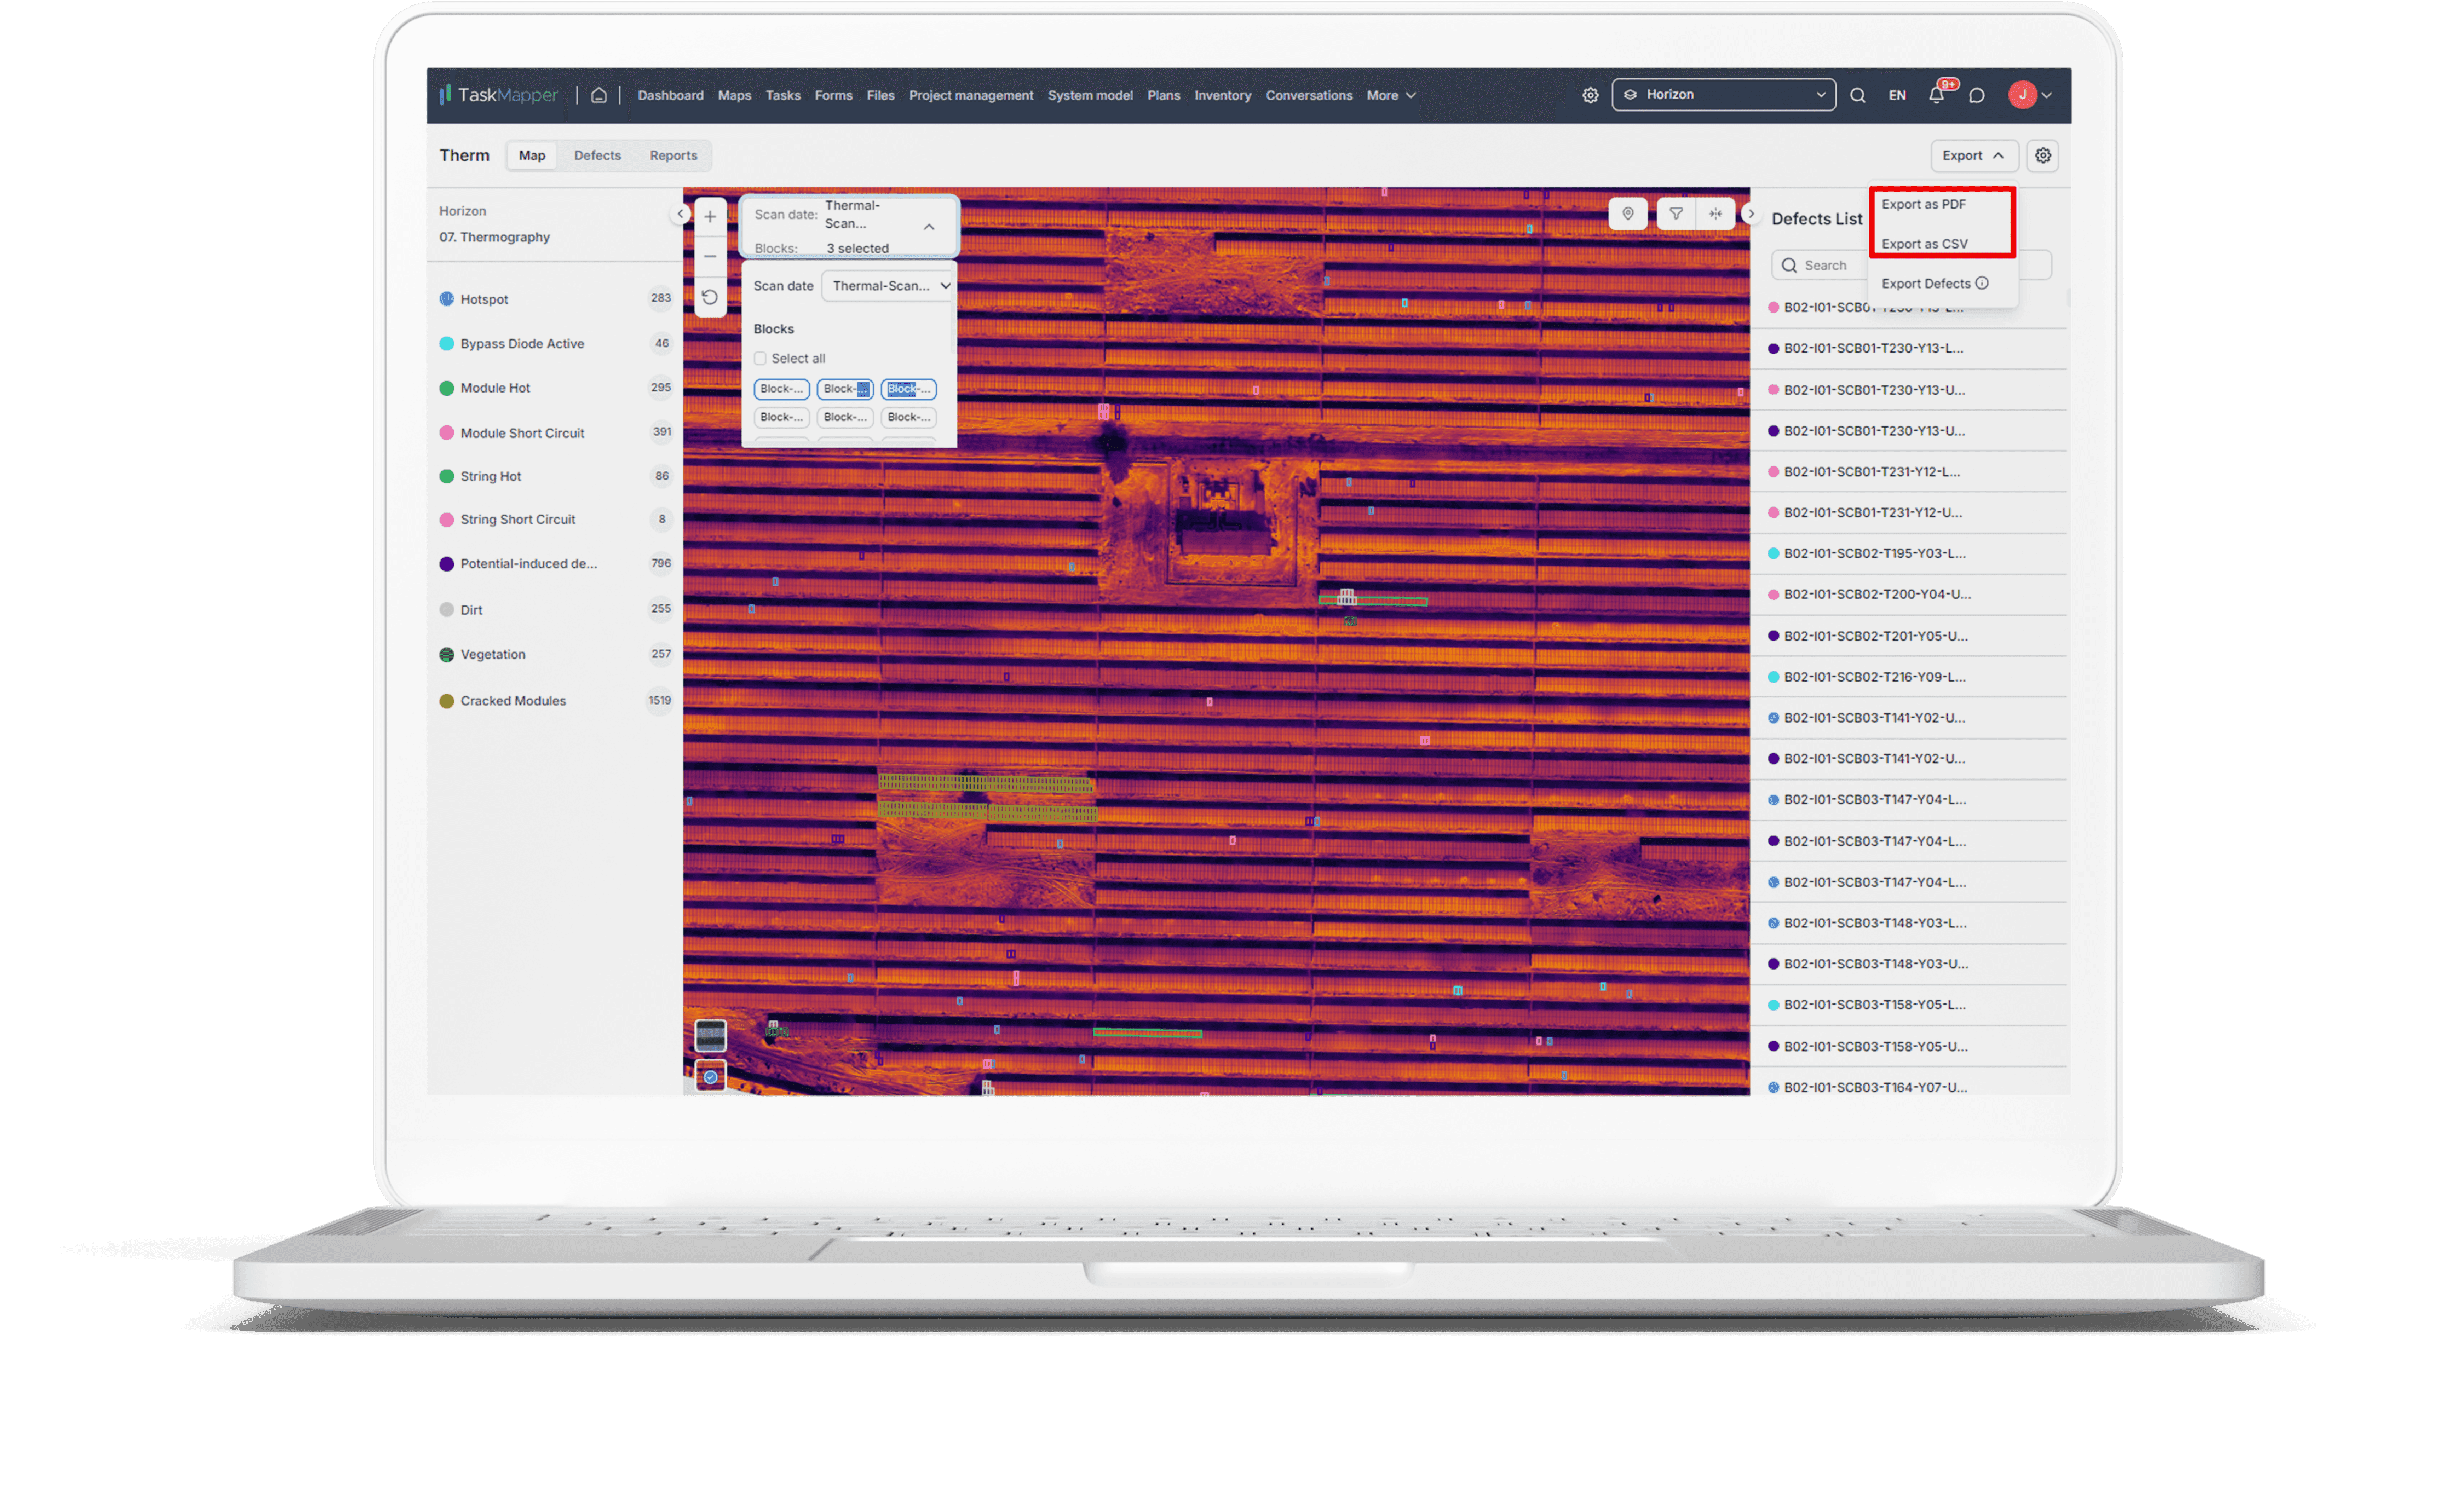
Teams create geo-located tasks directly on the map with assignee details and due dates, and manage them through to closure using the mobile app. Automated reports and customizable dashboards then give visibility into defect status across the entire portfolio.
How Drone Analytics Works: From Flight to Field Action
Plan: Define the flight path, resolution and sensors (RGB, thermal, or both) needed for the survey.
Capture: Fly the site to collect geotagged imagery across the defined area.
Process: Stitch raw images into an orthomosaic or thermal map of the full site.
AI Detection: Run automated analysis to identify defects or construction elements in the imagery.
Digital Twin Overlay: Overlay the processed map on the design or a previous survey to compare as-built vs. planned.
Tasks: Convert findings into geo-located, assigned tasks for field teams.
Report: Generate reports and dashboards to track closure and share status with stakeholders.
How TaskMapper Turns Drone Data into Action
TaskMapper by SenseHawk is a vertical enterprise SaaS solution designed for the solar industry, offering complete lifecycle solutions for utility-scale solar installations. It turns drone-acquired data into actionable insights for both construction and O&M, combining advanced analytics, AI-driven insights, and real-time task management to reduce delays and costs while streamlining collaboration. See it in action on the TaskMapper product page.
For Construction: Drone Construction Monitoring
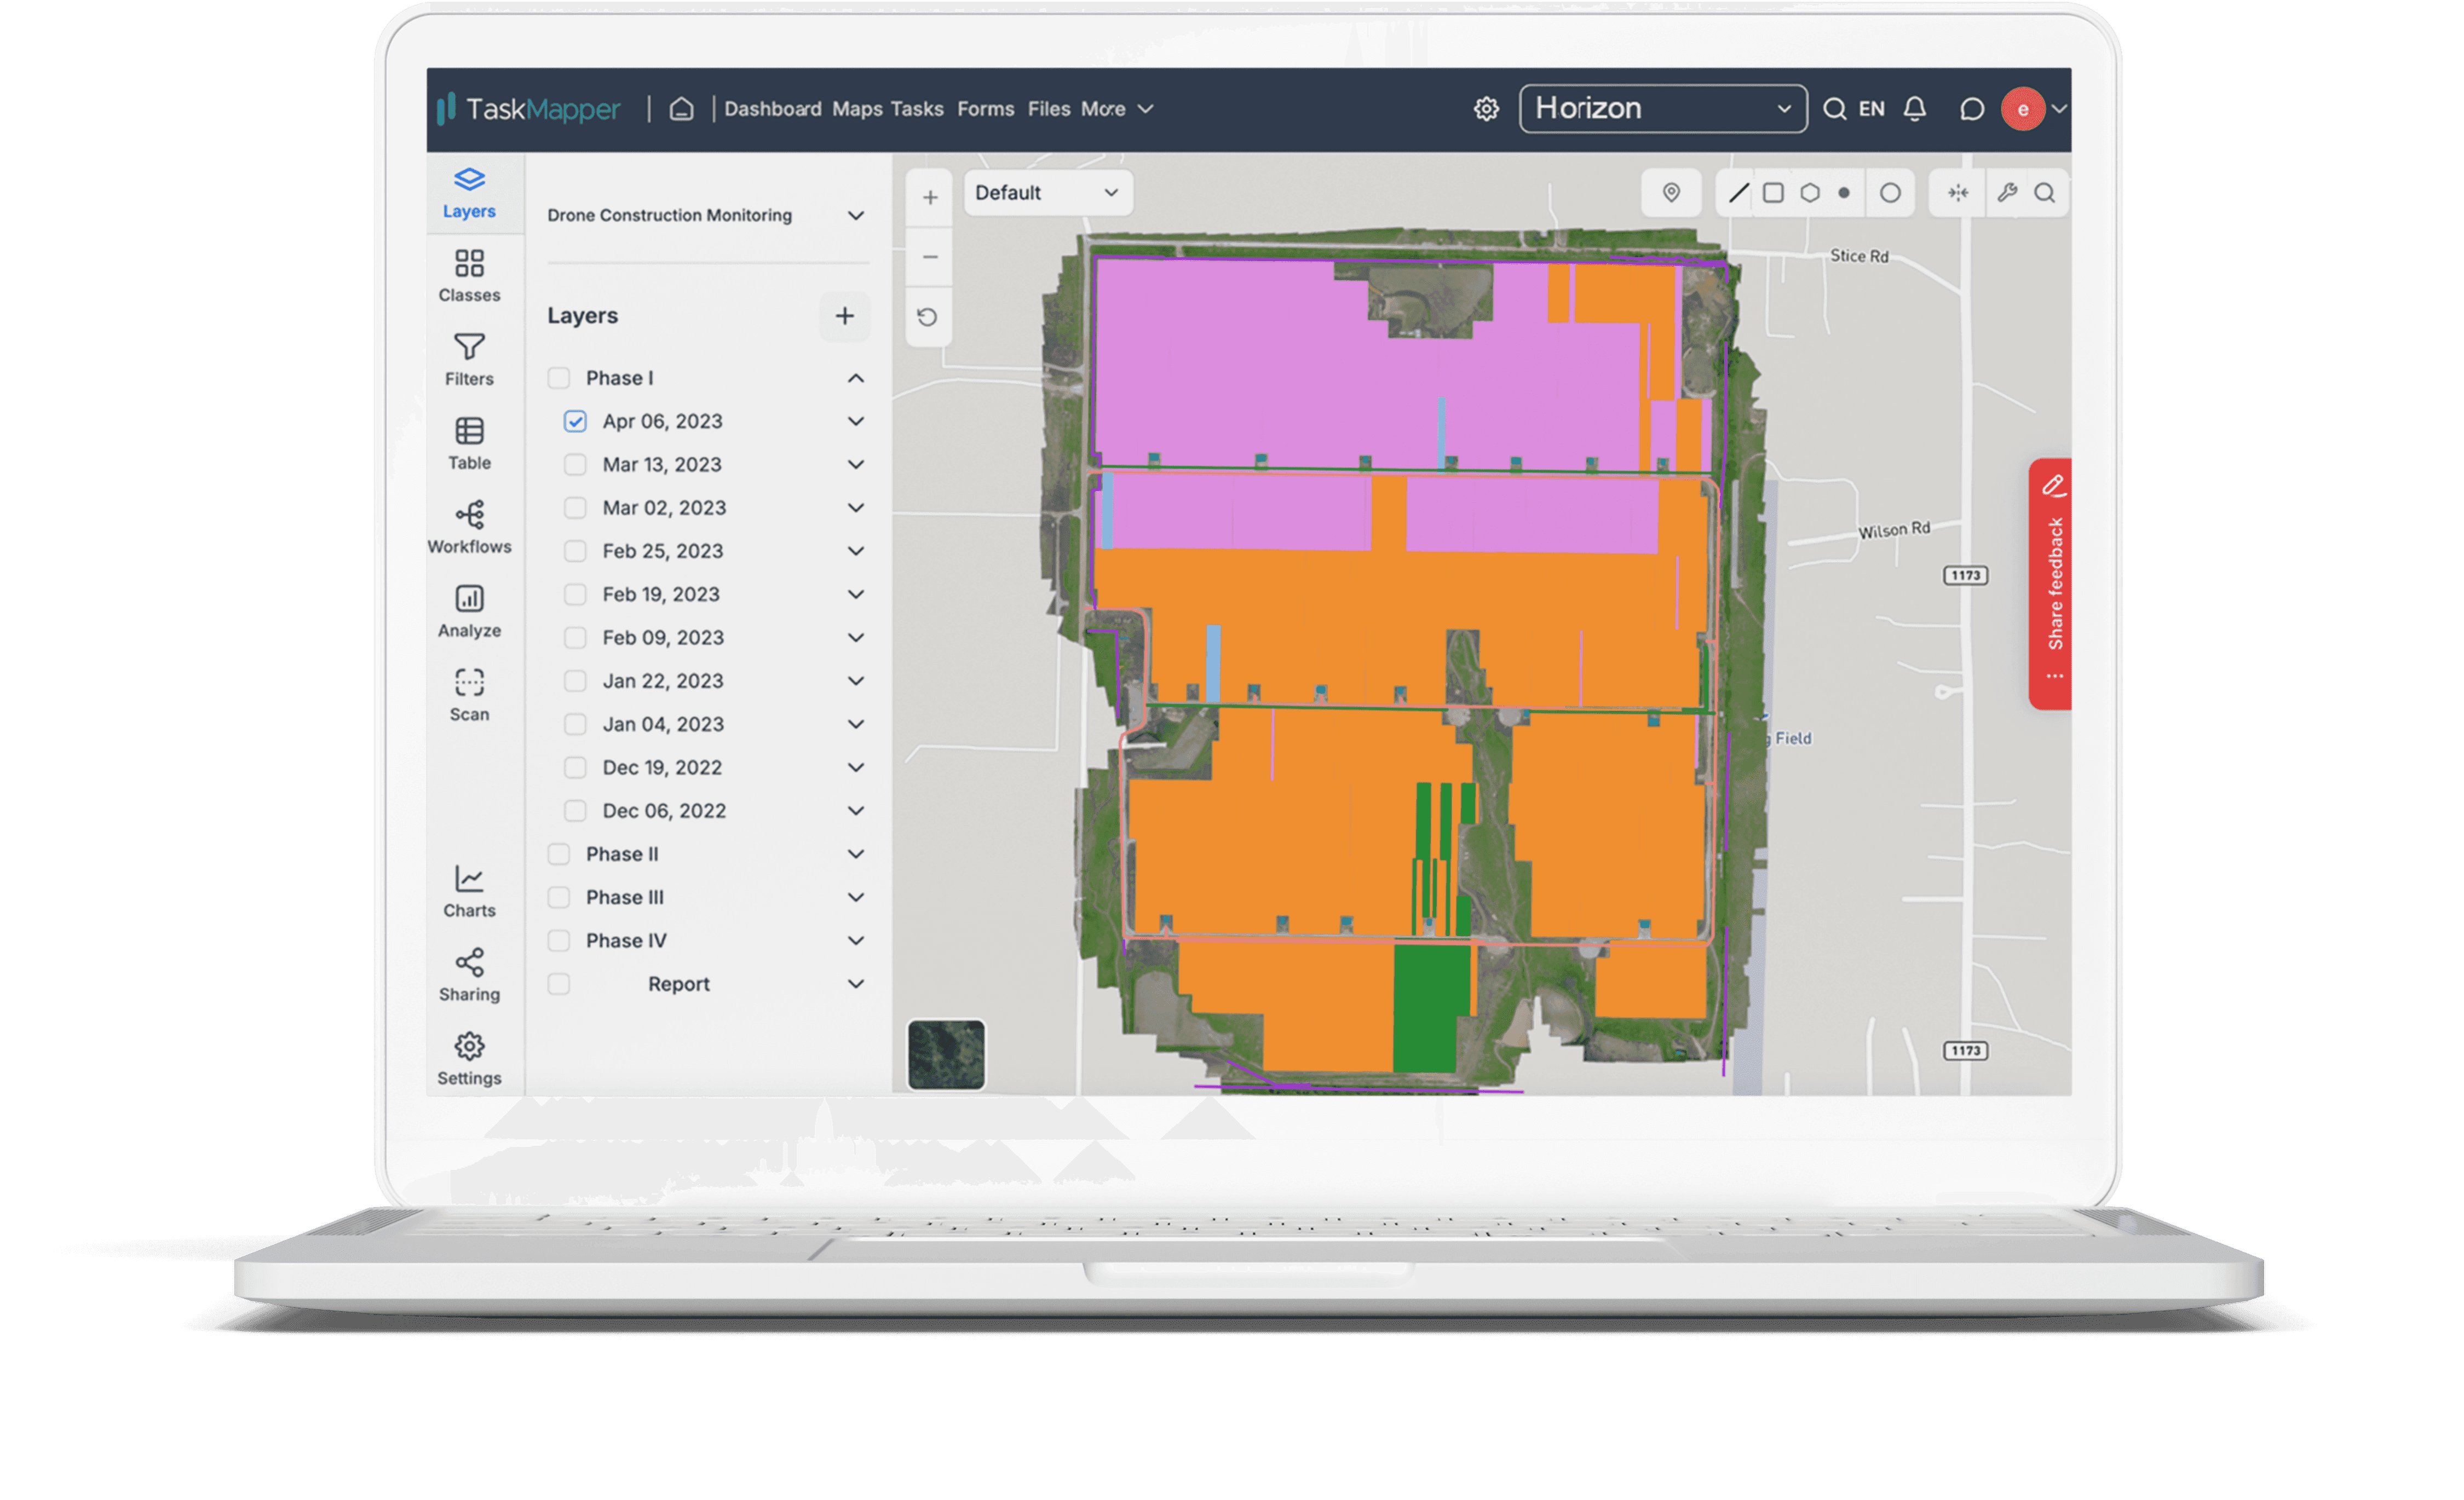
Comprehensive Visual Data: High-resolution maps with color-coded elements highlight activity progress for roads, trenches, piles, and trackers.
Layered component-level work progress data on Maps
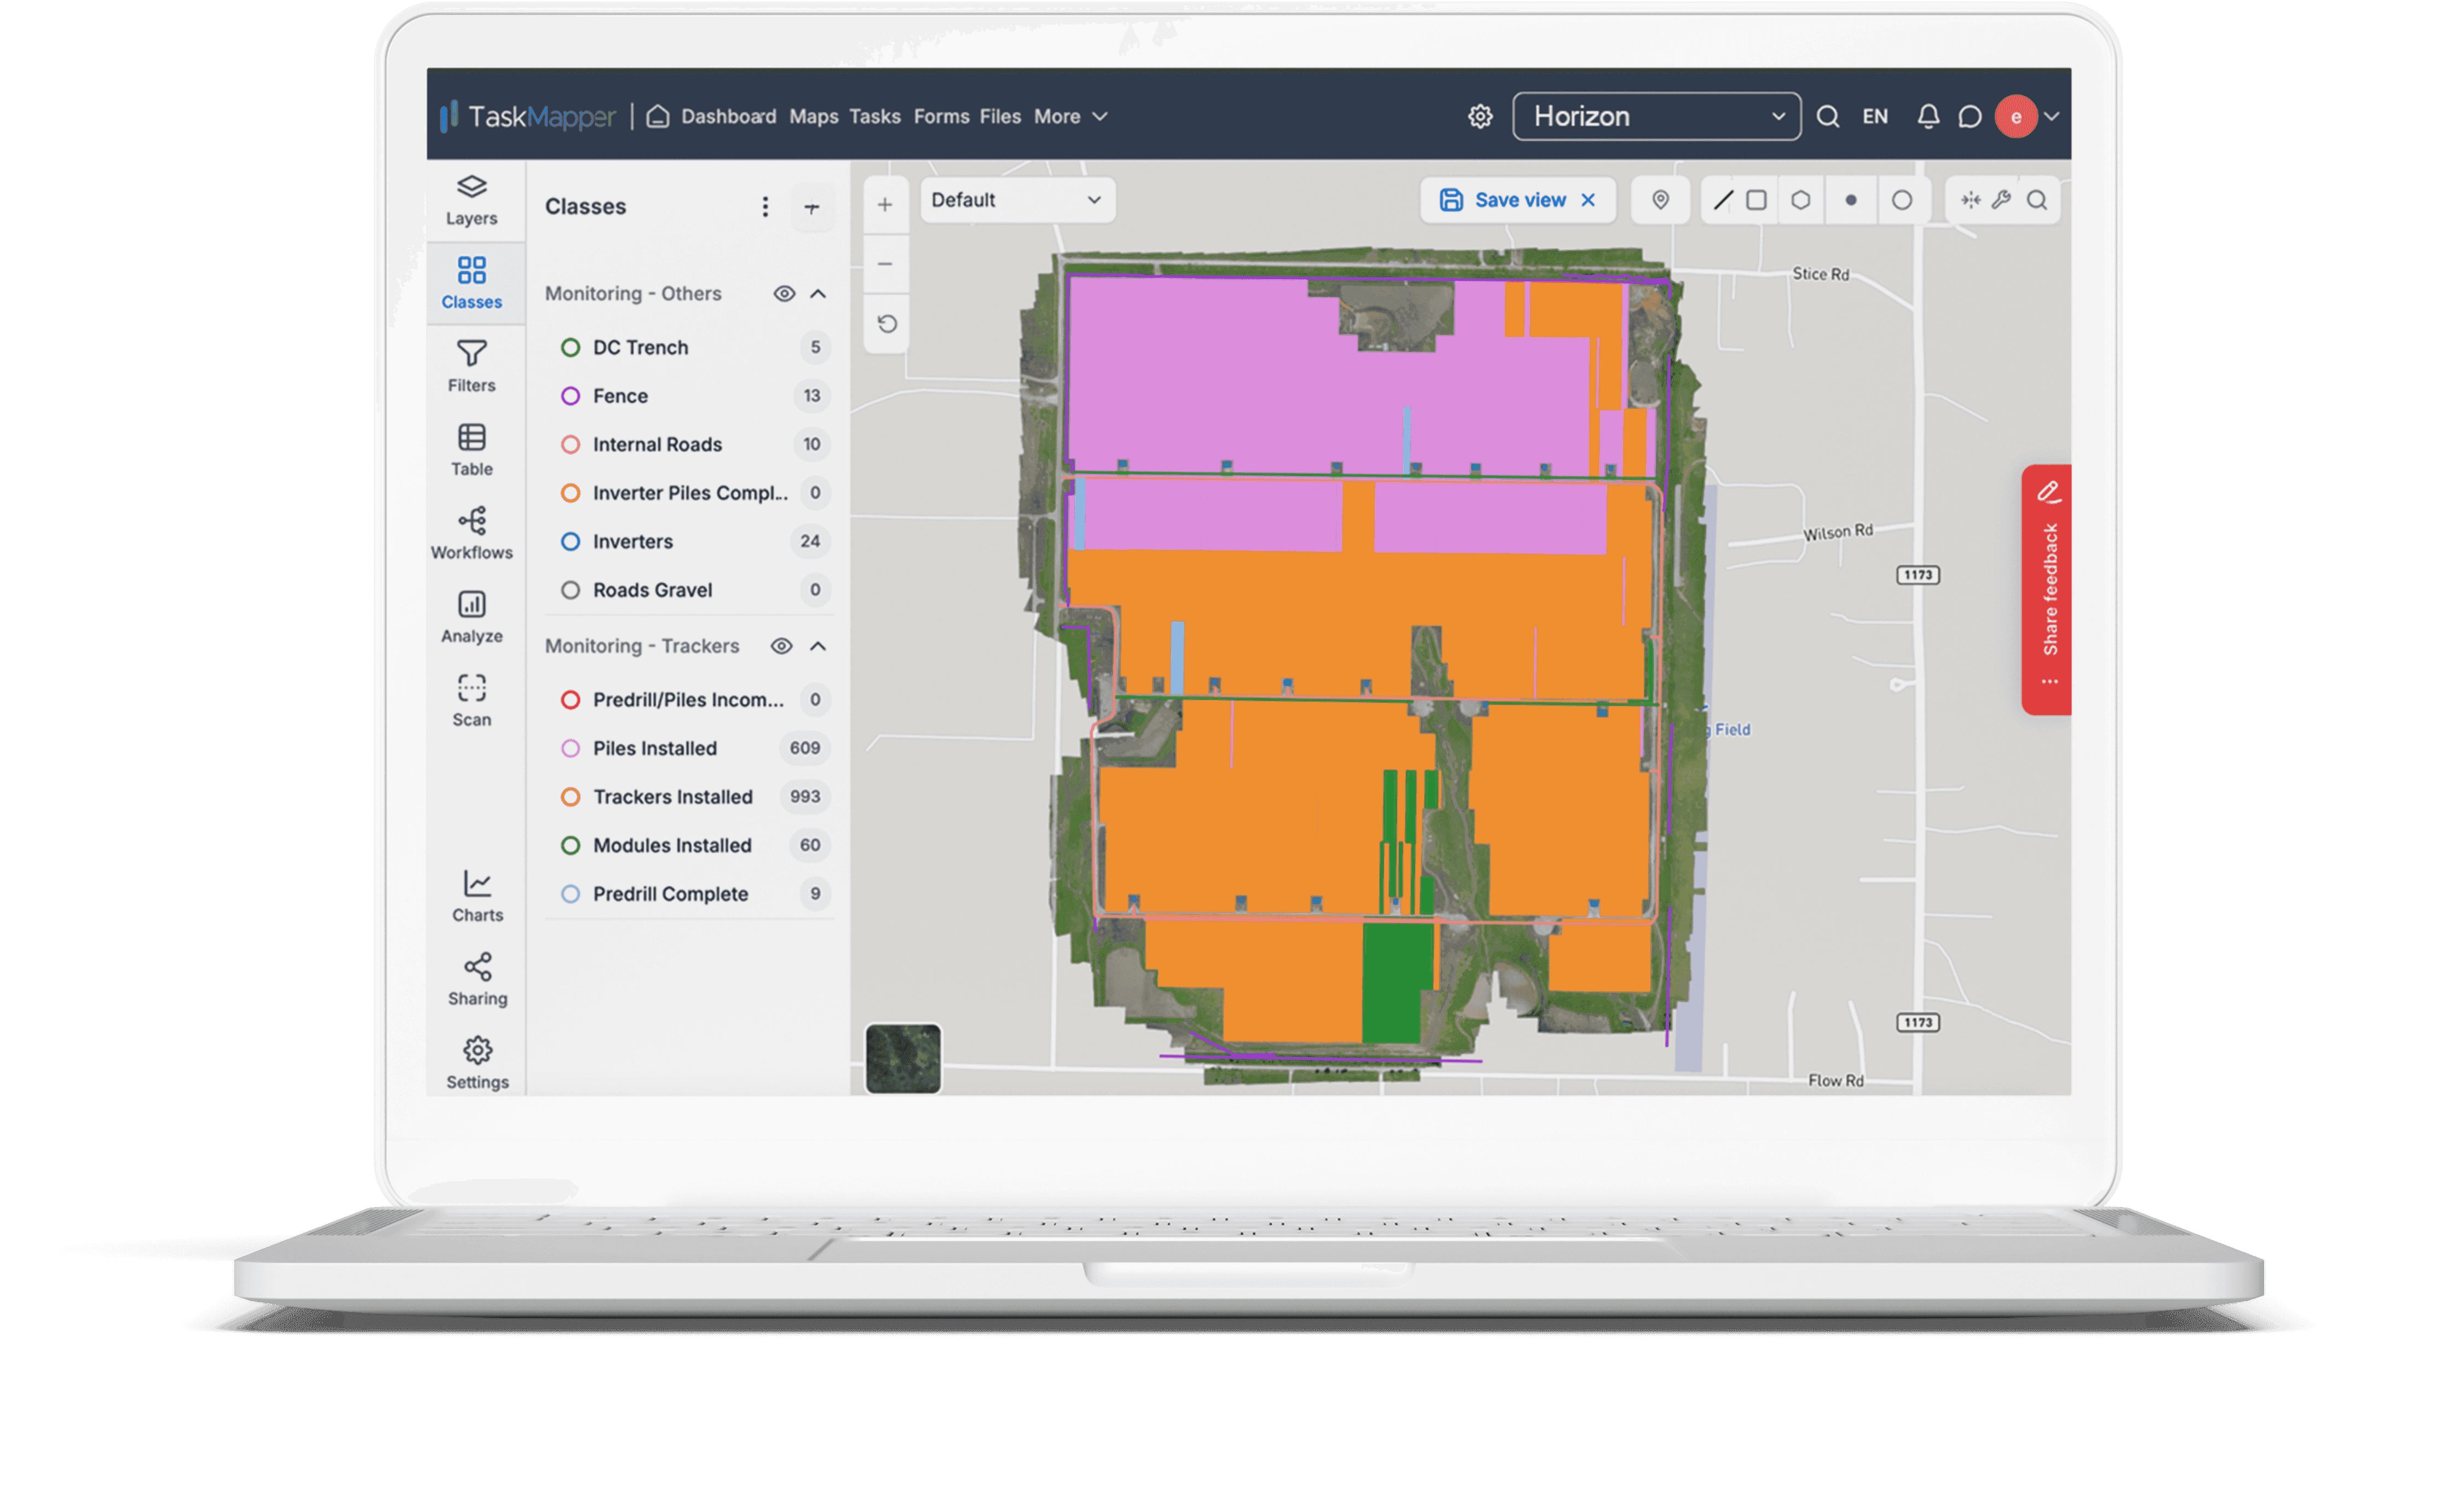
Detailed Classifications: Construction elements such as trenches, fences, roads, and inverters are categorized with colors and icons for easy status checks.
Installed component categories differentiated by color on digital site maps
Quantitative Data Integration: Maps paired with data tables provide insights into the installation progress of trackers, piles, and modules, ensuring accurate tracking.
Drone analytics gives solar developers and asset managers a faster, more accurate way to monitor construction progress and keep operating assets performing at their best. With TaskMapper, that data becomes advanced mapping, AI-driven insights, and real-time task management, turning solar project workflows into a more efficient, transparent, and cost-effective process.
Drone analytics in solar is the process of capturing drone imagery of a site and processing it with software and AI into maps, measurements and defect data that construction and O&M teams can act on.
What defects can drone thermal inspections detect on solar panels?
Thermal drone surveys can detect hotspots, bypass diode failures, string and module short circuits, potential-induced degradation (PID), and dirt or vegetation shading, among 20+ defect types SenseHawk Therm's AI can identify.
How often should utility-scale solar sites be inspected with drones?
Construction sites are typically surveyed on a regular cadence tied to build phases, while operating sites run periodic thermal surveys to catch developing defects before they cause downtime.
Can drone analytics replace manual inspections on solar sites?
Drone analytics replaces most routine, large-scale visual and thermal inspection work, while manual inspection is still used for close-up diagnostics and physical repairs.
What deliverables does drone analytics produce for solar construction teams?
Deliverables typically include orthomosaic and thermal maps, progress and quantity reports, as-built vs. design comparisons, and geo-located task lists.
By combining advanced mapping, AI-driven insights, and real-time task management, TaskMapper transforms solar project workflows into a more efficient, transparent, and cost-effective process.