


Dashboards
Dashboards
Dashboards
Set up custom dashboards tailored to different project stakeholders. Provide quick access to site reports, progress updates, and key insights.
Set up custom dashboards tailored to different project stakeholders. Provide quick access to site reports, progress updates, and key insights.
Set up custom dashboards tailored to different project stakeholders. Provide quick access to site reports, progress updates, and key insights.


Keep critical project parameters in view
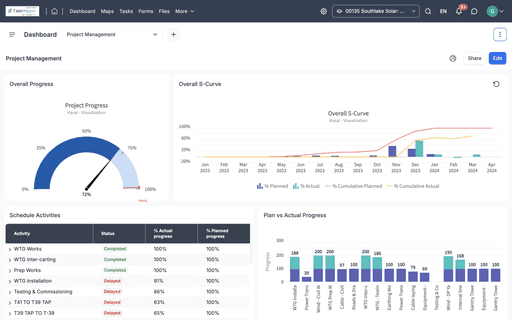
Keep critical project parameters in view
Create centralized dashboards to track and monitor activities across your asset or project. Access critical data-aerial scans, field updates, schedule milestones, and more-in one convenient location.
Create centralized dashboards to track and monitor activities across your asset or project. Access critical data-aerial scans, field updates, schedule milestones, and more-in one convenient location.
Create centralized dashboards to track and monitor activities across your asset or project. Access critical data-aerial scans, field updates, schedule milestones, and more-in one convenient location.
Keep critical project parameters in view
Centralize data from multiple applications
Centralize data from multiple applications
Design customized graphs, tables, and infographics using data from TaskMapper's integrated tools, including Maps, Tasks, Forms, Project Management, and Documents.
Design customized graphs, tables, and infographics using data from TaskMapper's integrated tools, including Maps, Tasks, Forms, Project Management, and Documents.
Design customized graphs, tables, and infographics using data from TaskMapper's integrated tools, including Maps, Tasks, Forms, Project Management, and Documents.
Centralize data from multiple applications




Advanced construction metrics at your fingertips
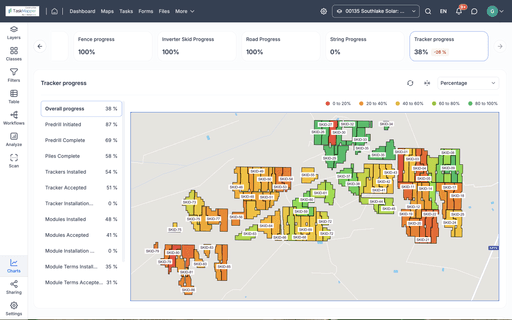
Advanced construction metrics at your fingertips
Gain comprehensive insights into your site's construction progress with TaskMapper. The advanced metrics include tracking work rates, catch-up rates, and predicted finish dates for various activities.
Gain comprehensive insights into your site's construction progress with TaskMapper. The advanced metrics include tracking work rates, catch-up rates, and predicted finish dates for various activities.
Gain comprehensive insights into your site's construction progress with TaskMapper. The advanced metrics include tracking work rates, catch-up rates, and predicted finish dates for various activities.
Advanced construction metrics at your fingertips


Complete oversight of projects from one screen
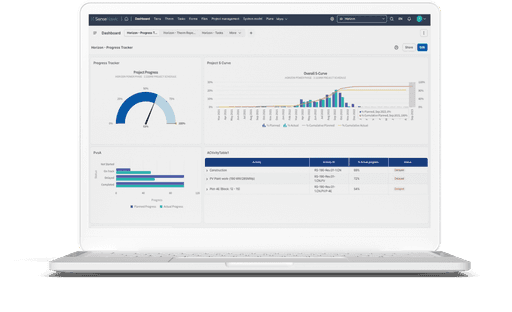
Complete oversight of projects from one screen
Complete oversight of projects from one screen
Access centralized information to track and monitor activities with dashboards.
Access centralized information to track and monitor activities with dashboards.
Access centralized information to track and monitor activities with dashboards.
Configure your dashboards to keep key metrics in view and drill down to view details for each project.
Configure your dashboards to keep key metrics in view and drill down to view details for each project.
Configure your dashboards to keep key metrics in view and drill down to view details for each project.
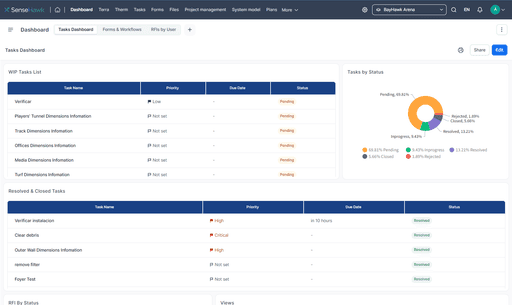
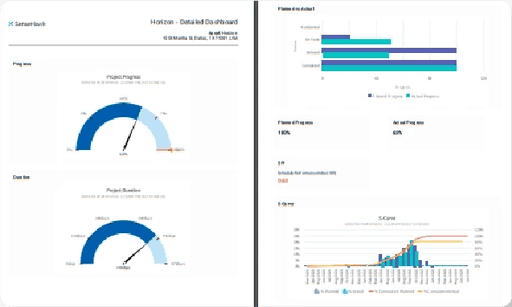
Track team performance and productivity directly from the tasks dashboard, gain insights with the project data analytics dashboard; use the construction progress dashboards to see if delivery is on track; and more.
Track team performance and productivity directly from the tasks dashboard, gain insights with the project data analytics dashboard; use the construction progress dashboards to see if delivery is on track; and more.
Track team performance and productivity directly from the tasks dashboard, gain insights with the project data analytics dashboard; use the construction progress dashboards to see if delivery is on track; and more.
Customizable dashboards for all stakeholders to quickly view site reports and progress updates.
Customizable dashboards for all stakeholders to quickly view site reports and progress updates.
Customizable dashboards for all stakeholders to quickly view site reports and progress updates.


Track WBS activities to manage their impact on the schedule
Track WBS activities to manage their impact on the schedule
Use dashboards to navigate through detailed work breakdowns for your project schedule. Create tables and charts to view activities vs. work breakdown. Monitor the impact of sub-activities on each main activity and take on-time action to keep delivery on track.
Use dashboards to navigate through detailed work breakdowns for your project schedule. Create tables and charts to view activities vs. work breakdown. Monitor the impact of sub-activities on each main activity and take on-time action to keep delivery on track.
Use dashboards to navigate through detailed work breakdowns for your project schedule. Create tables and charts to view activities vs. work breakdown. Monitor the impact of sub-activities on each main activity and take on-time action to keep delivery on track.
Track WBS activities to manage their impact on the schedule
Share dashboard information as PDFs
Share dashboard information as PDFs
Export any dashboard—with all the charts, tables, and images—into a PDF to share the information or provide updates. Easily print a dashboard view.
Export any dashboard—with all the charts, tables, and images—into a PDF to share the information or provide updates. Easily print a dashboard view.
Export any dashboard—with all the charts, tables, and images—into a PDF to share the information or provide updates. Easily print a dashboard view.
Share dashboard information as PDFs


After upgrading to TaskMapper, I have cut the 20-25 hours (of work) down to about 2. Not to mention the massive increase in quality of the SenseHawk report versus the typical Excel or Bluebeam-generated reports by superintendents.
Zachary Matheny, Project Administrator, Blue Ridge Power
SenseHawk is one of the leaders in leveraging new age technologies for improved solar asset management, and we have been successfully working with them for the last 2 years with good results
Sunil Modi, Head O&M, Adani Group

Having collaborated with SenseHawk for the past 3+ years, we have consistently experienced a level of reliability and competence that has contributed positively to the success of our projects.
Varun Singhal, Head – O&M, Performance, Sterling and Wilson Renewable Energy Limited

After upgrading to TaskMapper, I have cut the 20-25 hours (of work) down to about 2. Not to mention the massive increase in quality of the SenseHawk report versus the typical Excel or Bluebeam-generated reports by superintendents.
Zachary Matheny, Project Administrator, Blue Ridge Power
SenseHawk is one of the leaders in leveraging new age technologies for improved solar asset management, and we have been successfully working with them for the last 2 years with good results
Sunil Modi, Head O&M, Adani Group

Having collaborated with SenseHawk for the past 3+ years, we have consistently experienced a level of reliability and competence that has contributed positively to the success of our projects.
Varun Singhal, Head – O&M, Performance, Sterling and Wilson Renewable Energy Limited

After upgrading to TaskMapper, I have cut the 20-25 hours (of work) down to about 2. Not to mention the massive increase in quality of the SenseHawk report versus the typical Excel or Bluebeam-generated reports by superintendents.
Zachary Matheny, Project Administrator, Blue Ridge Power
SenseHawk is one of the leaders in leveraging new age technologies for improved solar asset management, and we have been successfully working with them for the last 2 years with good results
Sunil Modi, Head O&M, Adani Group

Having collaborated with SenseHawk for the past 3+ years, we have consistently experienced a level of reliability and competence that has contributed positively to the success of our projects.
Varun Singhal, Head – O&M, Performance, Sterling and Wilson Renewable Energy Limited

After upgrading to TaskMapper, I have cut the 20-25 hours (of work) down to about 2. Not to mention the massive increase in quality of the SenseHawk report versus the typical Excel or Bluebeam-generated reports by superintendents.
Zachary Matheny, Project Administrator, Blue Ridge Power
SenseHawk is one of the leaders in leveraging new age technologies for improved solar asset management, and we have been successfully working with them for the last 2 years with good results
Sunil Modi, Head O&M, Adani Group

Having collaborated with SenseHawk for the past 3+ years, we have consistently experienced a level of reliability and competence that has contributed positively to the success of our projects.
Varun Singhal, Head – O&M, Performance, Sterling and Wilson Renewable Energy Limited

After upgrading to TaskMapper, I have cut the 20-25 hours (of work) down to about 2. Not to mention the massive increase in quality of the SenseHawk report versus the typical Excel or Bluebeam-generated reports by superintendents.
Zachary Matheny, Project Administrator, Blue Ridge Power
SenseHawk is one of the leaders in leveraging new age technologies for improved solar asset management, and we have been successfully working with them for the last 2 years with good results
Sunil Modi, Head O&M, Adani Group

Having collaborated with SenseHawk for the past 3+ years, we have consistently experienced a level of reliability and competence that has contributed positively to the success of our projects.
Varun Singhal, Head – O&M, Performance, Sterling and Wilson Renewable Energy Limited

After upgrading to TaskMapper, I have cut the 20-25 hours (of work) down to about 2. Not to mention the massive increase in quality of the SenseHawk report versus the typical Excel or Bluebeam-generated reports by superintendents.
Zachary Matheny, Project Administrator, Blue Ridge Power
SenseHawk is one of the leaders in leveraging new age technologies for improved solar asset management, and we have been successfully working with them for the last 2 years with good results
Sunil Modi, Head O&M, Adani Group

Having collaborated with SenseHawk for the past 3+ years, we have consistently experienced a level of reliability and competence that has contributed positively to the success of our projects.
Varun Singhal, Head – O&M, Performance, Sterling and Wilson Renewable Energy Limited

After upgrading to TaskMapper, I have cut the 20-25 hours (of work) down to about 2. Not to mention the massive increase in quality of the SenseHawk report versus the typical Excel or Bluebeam-generated reports by superintendents.
Zachary Matheny, Project Administrator, Blue Ridge Power
SenseHawk is one of the leaders in leveraging new age technologies for improved solar asset management, and we have been successfully working with them for the last 2 years with good results
Sunil Modi, Head O&M, Adani Group

Having collaborated with SenseHawk for the past 3+ years, we have consistently experienced a level of reliability and competence that has contributed positively to the success of our projects.
Varun Singhal, Head – O&M, Performance, Sterling and Wilson Renewable Energy Limited

After upgrading to TaskMapper, I have cut the 20-25 hours (of work) down to about 2. Not to mention the massive increase in quality of the SenseHawk report versus the typical Excel or Bluebeam-generated reports by superintendents.
Zachary Matheny, Project Administrator, Blue Ridge Power
SenseHawk is one of the leaders in leveraging new age technologies for improved solar asset management, and we have been successfully working with them for the last 2 years with good results
Sunil Modi, Head O&M, Adani Group

Having collaborated with SenseHawk for the past 3+ years, we have consistently experienced a level of reliability and competence that has contributed positively to the success of our projects.
Varun Singhal, Head – O&M, Performance, Sterling and Wilson Renewable Energy Limited

After upgrading to TaskMapper, I have cut the 20-25 hours (of work) down to about 2. Not to mention the massive increase in quality of the SenseHawk report versus the typical Excel or Bluebeam-generated reports by superintendents.
Zachary Matheny, Project Administrator, Blue Ridge Power
SenseHawk is one of the leaders in leveraging new age technologies for improved solar asset management, and we have been successfully working with them for the last 2 years with good results
Sunil Modi, Head O&M, Adani Group

Having collaborated with SenseHawk for the past 3+ years, we have consistently experienced a level of reliability and competence that has contributed positively to the success of our projects.
Varun Singhal, Head – O&M, Performance, Sterling and Wilson Renewable Energy Limited

After upgrading to TaskMapper, I have cut the 20-25 hours (of work) down to about 2. Not to mention the massive increase in quality of the SenseHawk report versus the typical Excel or Bluebeam-generated reports by superintendents.
Zachary Matheny, Project Administrator, Blue Ridge Power
SenseHawk is one of the leaders in leveraging new age technologies for improved solar asset management, and we have been successfully working with them for the last 2 years with good results
Sunil Modi, Head O&M, Adani Group

Having collaborated with SenseHawk for the past 3+ years, we have consistently experienced a level of reliability and competence that has contributed positively to the success of our projects.
Varun Singhal, Head – O&M, Performance, Sterling and Wilson Renewable Energy Limited

After upgrading to TaskMapper, I have cut the 20-25 hours (of work) down to about 2. Not to mention the massive increase in quality of the SenseHawk report versus the typical Excel or Bluebeam-generated reports by superintendents.
Zachary Matheny, Project Administrator, Blue Ridge Power
SenseHawk is one of the leaders in leveraging new age technologies for improved solar asset management, and we have been successfully working with them for the last 2 years with good results
Sunil Modi, Head O&M, Adani Group

Having collaborated with SenseHawk for the past 3+ years, we have consistently experienced a level of reliability and competence that has contributed positively to the success of our projects.
Varun Singhal, Head – O&M, Performance, Sterling and Wilson Renewable Energy Limited

After upgrading to TaskMapper, I have cut the 20-25 hours (of work) down to about 2. Not to mention the massive increase in quality of the SenseHawk report versus the typical Excel or Bluebeam-generated reports by superintendents.
Zachary Matheny, Project Administrator, Blue Ridge Power
SenseHawk is one of the leaders in leveraging new age technologies for improved solar asset management, and we have been successfully working with them for the last 2 years with good results
Sunil Modi, Head O&M, Adani Group

Having collaborated with SenseHawk for the past 3+ years, we have consistently experienced a level of reliability and competence that has contributed positively to the success of our projects.
Varun Singhal, Head – O&M, Performance, Sterling and Wilson Renewable Energy Limited
Customers in
Countries
Satisfied Customers
Solar Sites & Assets
GW
Supported
ISO
27001
Certified
Countries
Customers in
Satisfied Customers
Solar Sites & Assets
GW
Supported
ISO
27001
Certified
Countries
Customers in
Satisfied Customers
Solar Sites & Assets
GW
Supported
Certified
27001
ISO
TaskMapper Solar
Products
TaskMapper Solar
Products
TaskMapper Solar

